Sleep may be a basic need, but the latest sleep statistics show it is anything but evenly distributed.
From age and income to race and region, U.S. adults report sharply different sleep patterns that reveal a widening gap between ideal sleep and real-world habits.
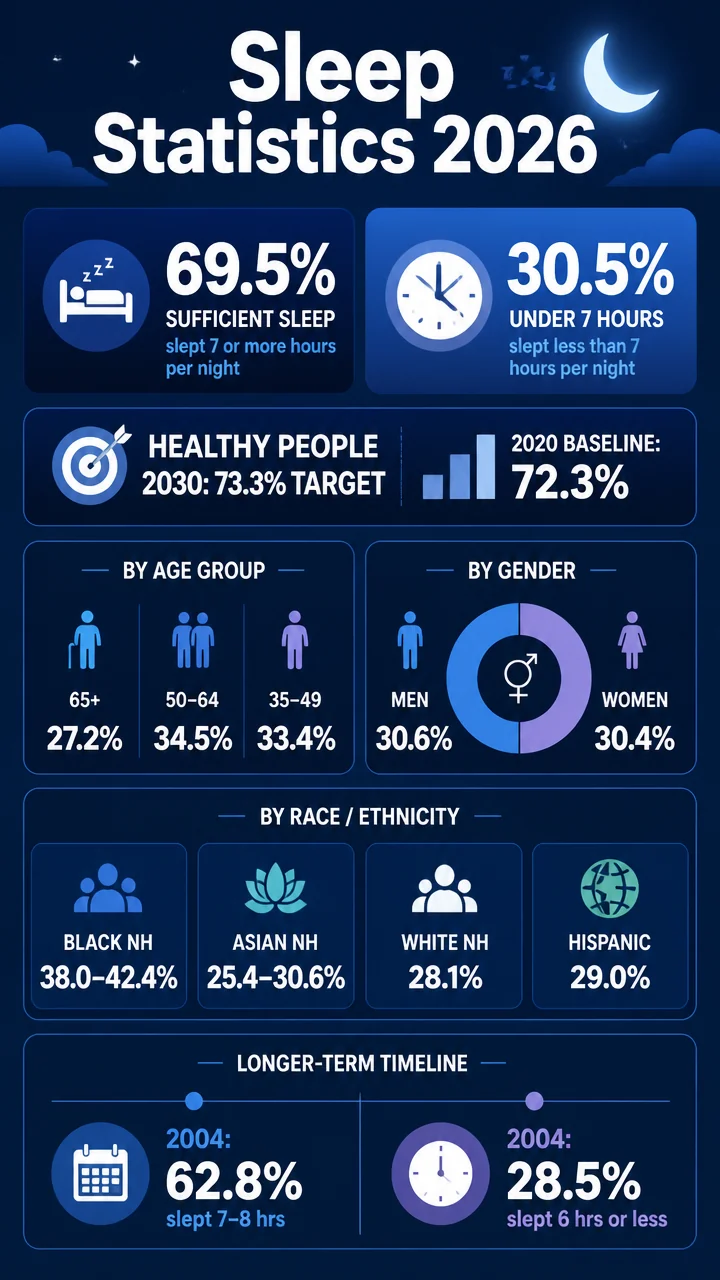
- 69.5% of U.S. adults age 18 and older got sufficient sleep in 2024.
- 30.5% of adults slept less than 7 hours on average in 2024.
- The share of adults sleeping less than 7 hours ranged from 27.2% among adults 65+ to 34.5% among adults 50 to 64.
- In 2024, Black, non-Hispanic adults had the highest reported short-sleep range at 38.0% to 42.4%.
- In 2004, adults below the poverty level were far more likely to sleep 6 hours or less (31.4%) than adults with family income at 4 times poverty level or more (66.5% slept 7 to 8 hours).
Sleep duration remains stubbornly clustered around the middle. In 2004, 62.8% of adults slept 7 to 8 hours; in 2024, 69.5% of adults were classified as getting sufficient sleep, but nearly one in three still slept less than 7 hours.
Sleep statistics at a glance
| Metric | Figure | What it shows |
|---|---|---|
| Adults with sufficient sleep, 2024 | 69.5% | Still below universal sleep goals, but a majority report enough sleep. |
| Adults sleeping less than 7 hours, 2024 | 30.5% | Roughly 3 in 10 adults are short-sleeping. |
| Healthy People 2030 target | 73.3% | The national benchmark remains ahead of the current rate. |
| 2020 baseline for sufficient sleep | 72.3% | Indicates where the target started relative to today’s numbers. |
| Adults sleeping 6 hours or less, 2004 | 28.5% age-adjusted | Shows the earlier long-run burden of short sleep. |
Sleep statistics and national trends
69.5% of U.S. adults age 18 and older got sufficient sleep in 2024, according to CDC FastStats.
That is a majority, but it still leaves a large share outside the recommended range.
The broader benchmark tells the same story.
Healthy People 2030 sets a target of 73.3% for sufficient sleep, while the 2020 baseline was 72.3%.
The 2022 measured rate was 69.9%, which means the nation remained below the target and below the baseline.
Even small percentage-point gaps matter at the population level.
When a national sleep benchmark is missed by several points, millions of adults are likely sleeping outside the ideal range.
Short sleep remains a major part of the picture.
In 2024, 30.5% of U.S. adults slept less than 7 hours on average in a 24-hour period.
That means nearly one in three adults are not reaching the recommended duration.
- 2024 sufficient sleep: 69.5%
- 2022 sufficient sleep: 69.9%
- Healthy People 2030 target: 73.3%
- 2020 baseline: 72.3%
Sleep statistics by age group
Age is one of the clearest predictors of sleep duration.
In 2024, the share of adults sleeping less than 7 hours varied by life stage, peaking in middle age and easing among older adults.
| Age group | Percent sleeping less than 7 hours, 2024 | Notable point |
|---|---|---|
| 65 and older | 27.2% | Lowest short-sleep rate in the dataset. |
| 35 to 49 | 33.4% | Higher than the overall adult average. |
| 50 to 64 | 34.5% | Highest short-sleep rate among the age groups provided. |
34.5% of adults age 50 to 64 slept less than 7 hours in 2024, making this group the most sleep-deprived in the age data provided.
The 2024 data suggest a familiar pattern: sleep strain intensifies during the years when work, caregiving, and health pressures often collide.
By contrast, adults 65 and older showed the lowest short-sleep share at 27.2%.
What the age split suggests
- Middle-aged adults are most likely to miss the 7-hour threshold.
- Older adults still face short sleep, but at a lower rate than working-age groups.
- The difference between 65+ adults and ages 50 to 64 is 7.3 percentage points.
Sleep statistics by sex and gender
The gap between men and women is small in 2024, but the figures are nearly identical.
That is notable because it suggests short sleep is a widespread adult issue rather than one limited to a single sex.
| Group | Percent sleeping less than 7 hours, 2024 |
|---|---|
| Men | 30.6% |
| Women | 30.4% |
30.6% of men and 30.4% of women slept less than 7 hours in 2024.
The difference is only 0.2 percentage points, which is essentially a tie.
- Men: 30.6% short sleep
- Women: 30.4% short sleep
- Gap between them: 0.2 points
- Overall adult short sleep: 30.5%
That near-perfect overlap suggests sleep duration is broadly shared across adults by sex, even if other demographic factors create larger differences.
Sleep statistics by race and ethnicity
Race and ethnicity show some of the most striking differences in the provided sleep statistics.
In 2024, Black, non-Hispanic adults had the highest reported range of sleeping less than 7 hours, while Asian, non-Hispanic adults had the lowest reported range.
| Group | Percent sleeping less than 7 hours, 2024 | Note |
|---|---|---|
| Black, non-Hispanic | 38.0% to 42.4% | Highest reported range. |
| Asian, non-Hispanic | 25.4% to 30.6% | Lowest reported range. |
| White, non-Hispanic | 28.1% | Below the overall adult average. |
| Hispanic | 29.0% | Close to the national average. |
Black, non-Hispanic adults showed the widest and highest short-sleep burden in the 2024 data, ranging from 38.0% to 42.4%.
For comparison, White, non-Hispanic adults were at 28.1% and Hispanic adults at 29.0%.
The Asian, non-Hispanic range spans 25.4% to 30.6%, which overlaps the national average but still indicates variation within the group.
Earlier race data show the same pattern
The 2004 dataset points in a similar direction.
Among adults sleeping 6 hours or less on a single-race basis:
- Black or African American adults: 34.5%
- Asian adults: 30.6%
- White adults: 27.6%
- Hispanic adults: 26.0%
That older snapshot shows Black adults at the highest short-sleep rate and White adults below them, reinforcing that sleep gaps have not appeared overnight.
Sleep statistics by education and income
Education and income are powerful lenses for understanding sleep.
In the 2004 CDC data, the share of adults sleeping 7 to 8 hours was much higher among people with more schooling and higher incomes.
| Category | Sleep measure | Figure |
|---|---|---|
| Adults with GED diploma | Slept 7 to 8 hours | 53.5% |
| Adults with master’s, doctorate, or medical degree | Slept 7 to 8 hours | 70.7% |
| Adults below poverty level | Slept 6 hours or less | 31.4% |
| Adults at 4 times poverty level or more | Slept 7 to 8 hours | 66.5% |
| Adults below poverty level | Slept 9 hours or more | 13.5% |
| Adults at 1 to less than 2 times poverty level | Slept 9 hours or more | 11.0% |
70.7% of adults with a master’s, doctorate, or medical degree slept 7 to 8 hours, compared with 53.5% of adults with a GED diploma.
That is a gap of 17.2 percentage points in the preferred sleep range.
Education and income appear closely tied to sleep regularity.
The more advantaged groups in the dataset are more concentrated in the 7-to-8-hour band, while lower-income adults are more exposed to short sleep or long sleep.
Income shows the same shape.
31.4% of adults below the poverty level slept 6 hours or less, while 66.5% of adults with family income at 4 times poverty level or more slept 7 to 8 hours.
In other words, the highest-income group was much more likely to fall into the middle sleep duration band.
- Higher education: more 7-to-8-hour sleep
- Lower education: less concentration in the ideal range
- Lower income: more short sleep and more long sleep
- Higher income: more stable sleep duration
Sleep statistics by marital status
Marital status also appears to matter, especially for short sleep.
In 2004, divorced or separated adults had the highest short-sleep share among the categories provided.
| Marital status | Percent sleeping 6 hours or less, 2004 | Percent sleeping 9 hours or more, 2004 |
|---|---|---|
| Never married | 27.5% | 11.0% |
| Married | Not provided | 7.3% |
| Divorced or separated | 36.1% | Not provided |
| Widowed women | Not provided | 13.9% |
36.1% of divorced or separated adults slept 6 hours or less, the highest short-sleep share in the marital-status figures provided.
Never-married adults were lower at 27.5%, but still well above the national ideal.
Divorced or separated adults had a 36.1% short-sleep rate, a sign that major life transitions can coincide with poorer sleep duration.
Long sleep shows another pattern.
13.9% of widowed women slept 9 hours or more, compared with 11.0% of never-married adults and 7.3% of married adults.
Sleep statistics by geography
Regional differences are visible in the 2004 data, especially in the share of adults sleeping 7 to 8 hours.
The West stood out as the strongest region for the middle sleep band.
| Region | Sleep measure | Figure |
|---|---|---|
| West | Slept 7 to 8 hours | 66.2% |
| Northeast | Slept 7 to 8 hours | 61.3% |
| South | Slept 9 hours or more | 9.3% |
| Northeast | Slept 9 hours or more | 7.7% |
| Women in the West | Slept 6 hours or less | 24.9% |
66.2% of adults in the West slept 7 to 8 hours, compared with 61.3% in the Northeast.
That 4.9-point difference makes the West the strongest region in the provided data for the target sleep range.
- West: 66.2% slept 7 to 8 hours
- Northeast: 61.3% slept 7 to 8 hours
- South: 9.3% slept 9 hours or more
- Northeast: 7.7% slept 9 hours or more
Among women, regional variation also appeared in short sleep.
24.9% of women in the West slept 6 hours or less, showing that even the strongest region still had a meaningful short-sleep burden.
Sleep statistics from 2004 vs. 2024: what changed?
These two data snapshots are not directly identical in every measure, but together they show a consistent pattern: sleep duration is concentrated in a middle band, and short sleep remains widespread.
- 2004: 28.5% of adults slept 6 hours or less on an age-adjusted basis.
- 2004: 62.8% slept 7 to 8 hours.
- 2004: 8.7% slept 9 hours or more.
- 2024: 69.5% of adults got sufficient sleep.
- 2024: 30.5% slept less than 7 hours.
The takeaway is not that sleep problems disappeared, but that the national distribution still leaves roughly a third of adults short on sleep in the modern data.
The pattern also remains uneven by demographic group.
Adults in the most advantaged education and income groups were consistently more likely to land in the 7-to-8-hour range, while Black adults, lower-income adults, and divorced or separated adults were more likely to fall below it.
Most notable sleep statistics and rankings
Here are the standout numbers from the dataset, grouped for quick scanning:
- Highest 2024 short-sleep rate by age: adults 50 to 64 at 34.5%
- Lowest 2024 short-sleep rate by age: adults 65+ at 27.2%
- Highest 2024 short-sleep range by race/ethnicity: Black, non-Hispanic adults at 38.0% to 42.4%
- Lowest 2024 short-sleep range by race/ethnicity: Asian, non-Hispanic adults at 25.4% to 30.6%
- Highest 2004 7-to-8-hour rate by education: adults with a master’s, doctorate, or medical degree at 70.7%
- Highest 2004 short-sleep rate by marital status: divorced or separated adults at 36.1%
- Highest 2004 7-to-8-hour regional rate: adults in the West at 66.2%
Sleep statistics in the United States are not just about how long people sleep; they are about who gets enough sleep, who does not, and which demographic groups are most exposed to short sleep.
What these sleep statistics mean for readers and researchers
For readers scanning the numbers, the message is straightforward: the national average masks large subgroup differences.
Middle-aged adults, Black adults, lower-income adults, and divorced or separated adults show the most pronounced short-sleep burden in the supplied data.
For researchers and content strategists, the strongest SEO angles in these sleep statistics are clear:
- Sleep duration trends remain a major public-health topic.
- Demographic splits create the most compelling comparisons.
- Education and income help explain who is most likely to reach the 7-to-8-hour range.
- Regional differences add another layer of interest for U.S.-focused audiences.
30.5% short sleep, 69.5% sufficient sleep, and clear demographic disparities make this a story about more than bedtime.
It is a snapshot of how sleep is distributed across American life.