Home decor statistics reveal a market that is still deeply store-driven, increasingly omnichannel, and large enough to support specialty giants, warehouse formats, and premium design-center chains all at once.
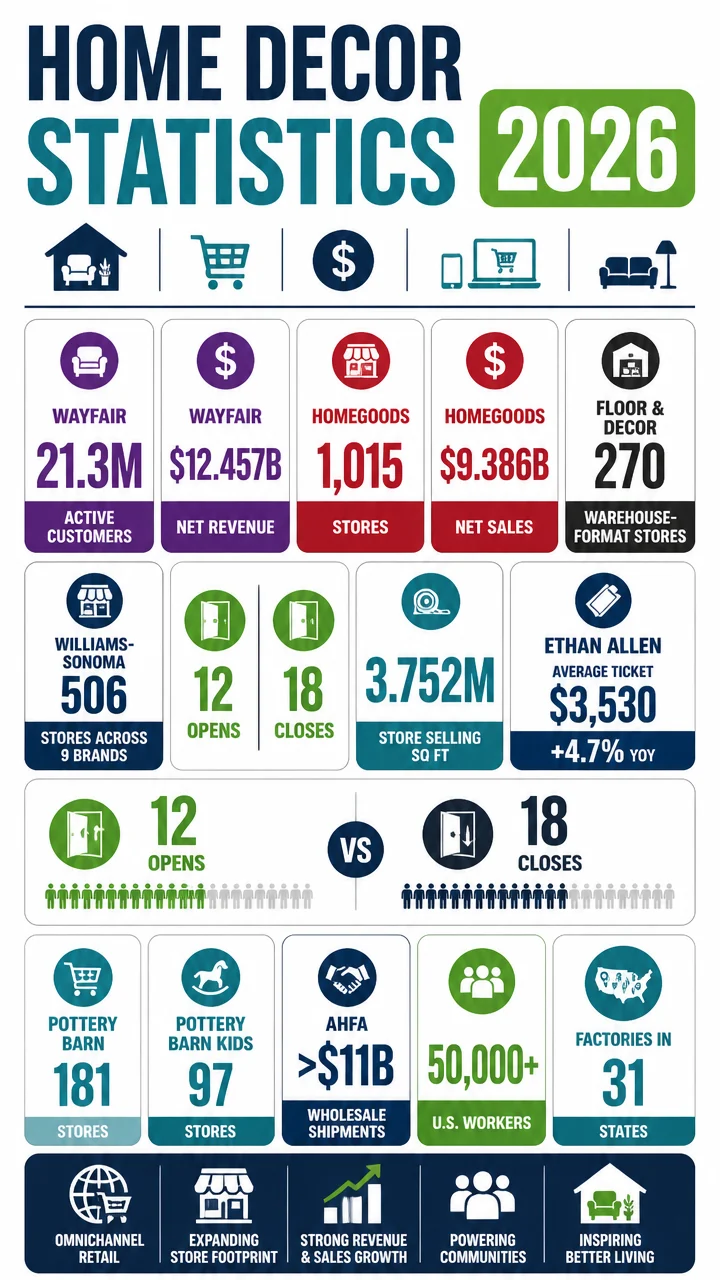
From Wayfair’s 21.3 million active customers to HomeGoods’ 1,015 stores and Floor & Decor’s 270 warehouse-format locations, the latest figures show where the category is expanding, where sales are concentrated, and which brands are winning on scale.
- Wayfair reported $12.457 billion in 2025 net revenue.
- HomeGoods generated $9.386 billion in fiscal 2025 net sales.
- Floor & Decor ended 2025 with 270 warehouse-format stores.
- Williams-Sonoma operated 506 stores across nine brands at fiscal 2025 year-end.
- Ethan Allen reported an average ticket of $3,530, up 4.7% year over year.
Home decor statistics: the big-picture market overview
Big number: more than $11 billion. That is the wholesale shipment value AHFA said its members provided for U.S. households in 2018, a reminder of how substantial the home furnishings supply chain remains behind the retail shelf.
The same AHFA industry facts also show the sector’s physical footprint is widely distributed: member companies operated factories in 31 states and multiple foreign countries, while employing more than 50,000 U.S. workers in furniture production.
Home decor is not just a retail category.
It is a manufacturing, logistics, design, and omnichannel category that spans domestic production, imported goods, and both large-format and specialty-store merchandising.
Fast facts on the home decor landscape
- AHFA describes itself as the only trade association serving the U.S. residential furniture industry.
- Wayfair, HomeGoods, Floor & Decor, Williams-Sonoma, and Ethan Allen all illustrate different ways to sell home decor at scale.
- The category now stretches from pure-play digital retail to destination stores and design-center models.
Home decor retail chains and store counts
Store count remains one of the clearest signals in home decor. Even in a digital era, the biggest names still rely on physical locations to build trust, showcase style, and drive larger baskets.
| Retailer | Latest store count | Additional footprint detail |
|---|---|---|
| HomeGoods | 943 stores | Part of a 1,015-store HomeGoods segment including Homesense |
| Williams-Sonoma | 506 stores | Operates 9 brands across retail, e-commerce, catalog, and B2B channels |
| Kirkland’s | 314 stores | Locations across 35 states |
| Floor & Decor | 270 warehouse-format stores | Plus 5 design studios |
| Ethan Allen | 187 total design centers | 172 in North America and 15 outside North America |
- HomeGoods is the largest store network in this dataset, with 943 HomeGoods stores and 1,015 total HomeGoods-segment stores including Homesense.
- Williams-Sonoma runs fewer stores than HomeGoods, but across a broader brand portfolio.
- Floor & Decor is smaller in store count than HomeGoods, yet its stores are much larger and inventory-heavy.
- Ethan Allen remains a design-center story, not just a store-count story.
Williams-Sonoma: portfolio breadth over pure store count
506 stores is only part of the Williams-Sonoma picture.
The company markets through nine brands: Williams Sonoma, Pottery Barn, Pottery Barn Kids, Pottery Barn Teen, West Elm, Williams Sonoma Home, Rejuvenation, Mark and Graham, and GreenRow.
That portfolio is distributed across e-commerce, retail stores, direct-mail catalogs, and business-to-business channels, showing how home decor brands can diversify both merchandising and customer acquisition.
| Williams-Sonoma brand | Fiscal 2025 stores | Average square feet per store |
|---|---|---|
| Pottery Barn | 181 | 15,000 |
| West Elm | 117 | 13,800 |
| Williams Sonoma | 111 | 8,700 |
| Pottery Barn Kids | 97 | 8,300 |
| Pottery Barn Teen | 37 | 5,000 |
| Rejuvenation | 30 | 4,400 |
Pottery Barn is Williams-Sonoma’s largest store banner in this dataset, while West Elm combines a high store count with large average selling space.
At the smaller end, Rejuvenation and Pottery Barn Teen show how niche positioning often pairs with leaner store footprints.
Ethan Allen: fewer locations, higher-value engagement
187 total design centers is modest compared with HomeGoods or Williams-Sonoma, but Ethan Allen’s model is built around consultation and larger ticket sizes.
- 172 design centers were in North America.
- 15 additional design centers were outside North America.
- 142 North American locations were company-operated.
- 30 were independently owned and operated.
- The company opened 4 new company-operated design centers in fiscal 2025.
Why it matters: Ethan Allen’s store network is smaller, but the selling model is highly monetizable because it combines larger spaces, design expertise, and higher ticket values.
Home decor statistics on e-commerce, customers, and revenue scale
Wayfair remains the standout digital-scale story in home decor. The company posted $12.457 billion in total net revenue in 2025, up $606 million year over year, or 5.1%.
21.3 million active customers and 40 million delivered orders in one year give Wayfair one of the clearest demand snapshots in online home goods.
| Wayfair metric | 2025 figure |
|---|---|
| Total net revenue | $12.457 billion |
| U.S. net revenue | $10.973 billion |
| International net revenue | $1.484 billion |
| Active customers | 21.3 million |
| LTM net revenue per active customer | $586 |
| Delivered orders | 40 million |
| Average order value | $312 |
| Cash and short-term investments | $1.5 billion |
| Total liquidity | $1.9 billion |
Several patterns stand out:
- U.S. revenue dominated at $10.973 billion, compared with $1.484 billion internationally.
- Revenue per active customer reached $586, showing meaningful monetization across a very broad customer base.
- 40 million orders at a $312 average order value signals a high-velocity basket flow.
- Wayfair combines marketplace-like scale with a home-category average order that is still relatively high versus general retail.
- Its liquidity position of $1.9 billion provides room to keep investing in logistics, marketing, and technology.
- The company’s customer footprint is broad enough to support category-wide demand trends, not just one seasonal shopping cycle.
Home decor industry data and specialty retail benchmarks
Not every home decor chain competes the same way. Some win on value and scale, some on curation, and some on room-by-room design consultation.
HomeGoods: the mass-market powerhouse
HomeGoods generated $9.386 billion in net sales in fiscal 2025, up 4% year over year, with comp store sales also up 4%.
The segment posted $1.021 billion in profit and a 10.9% profit margin, showing that the off-price home model can still deliver substantial earnings at scale.
- 943 HomeGoods stores at year-end fiscal 2025, up from 919 in fiscal 2024.
- 72 Homesense stores, up from 55 in fiscal 2024.
- 1,015 total stores in the segment.
- 19 million square feet of selling space.
- Expected fiscal 2026 openings: 30 new HomeGoods stores, including 9 Homesense stores.
- Expected selling-square-footage growth from openings: about 3%.
Big number: 1,015 stores is one of the largest retail footprints in the home decor category, and it helps explain HomeGoods’ reach across the value-oriented shopper base.
Floor & Decor: warehouse format, high inventory intensity
270 warehouse-format stores may sound smaller than HomeGoods, but Floor & Decor runs a very different model centered on scale per location.
| Floor & Decor metric | 2025 figure |
|---|---|
| Warehouse-format stores | 270 |
| Average store size | 76,000 square feet |
| Average SKUs per store | 4,200 |
| Average flooring products per store | 1.0 million square feet |
| Average inventory at cost per store | $2.7 million |
| Net sales | $4.684 billion |
| Net income | $208.647 million |
| Adjusted EBITDA | $538.171 million |
| Comparable store sales | declined 1.8% |
Why it matters: Floor & Decor’s model is inventory-intensive and square-footage-heavy, making it a good benchmark for how a specialty home retailer uses physical scale to sell large-ticket flooring products.
The company also added 20 new warehouse-format stores in fiscal 2025, closed one, and finished the year with five design studios.
Ethan Allen’s ticket economics stand out
Among the most quotable home decor statistics in the dataset is Ethan Allen’s pricing power.
Its average ticket value was $3,530 in 2025, up 4.7% year over year.
Even more striking, its average written ticket was $7,781, while design consultant engagement contributed 33.5% of total written sales.
- Ethan Allen’s model is anchored in guided selling rather than high-frequency transactions.
- Ticket size suggests a category where a single customer interaction can materially move revenue.
- Design support remains a measurable sales lever, not just a branding message.
Home decor market data by geography and industry footprint
The home decor supply chain is more geographically dispersed than many shoppers realize. AHFA member companies operated factories in 31 states and multiple foreign countries, while retail chains like Kirkland’s operated across 35 states and Ethan Allen maintained 15 design centers outside North America.
| Company or industry | Geographic reach | What stands out |
|---|---|---|
| AHFA members | 31 states plus multiple foreign countries | Manufacturing base spans domestic and international production |
| Kirkland’s | 35 states | Broad regional store distribution |
| Ethan Allen | 15 locations outside North America | Global design-center presence |
| Wayfair | $1.484 billion international revenue | Meaningful cross-border demand, but U.S. still dominates |
Fast fact: The category is not just concentrated in a few coastal markets.
Manufacturing, retail, and design all stretch across multiple states and regions.
Retail stress signals and demand softness
The Census reported U.S. furniture and home furnishings store sales were down 7.4% year over year in June 2024, and eight states had negative and significant year-over-year changes in that same period.
That is an important reminder that home decor demand can be lumpy.
Individual chains may still post growth, but macro data can show category pressure, regional variation, and uneven consumer spending.
- Category health can vary by state, not just by national headline numbers.
- Large retailers with diversified footprints may absorb weak months better than smaller chains.
- Physical store productivity and customer mix matter when category sales soften.
What these home decor statistics say about the market
The clearest theme across the data is scale with specialization. Some players win with huge store footprints, others with expansive e-commerce, and others by concentrating on high-touch, high-ticket design consultation.
- HomeGoods leads on store count and value-driven reach.
- Wayfair leads on digital revenue, customer count, and order volume.
- Floor & Decor leads on warehouse format, average store size, and inventory intensity.
- Williams-Sonoma leads on brand architecture and multichannel merchandising.
- Ethan Allen leads on premium-ticket, consultant-driven sales economics.
The numbers also show that home decor remains a category where square footage still matters.
Williams-Sonoma’s store portfolio included 3.752 million square feet of selling space and 5.762 million square feet of leased space at year-end fiscal 2025, while HomeGoods alone had 19 million square feet of selling space.
That physical footprint exists alongside customer-rich digital models like Wayfair, whose 21.3 million active customers and 40 million orders suggest that online home shopping has moved well beyond niche status.
Home decor is a category where the winner is rarely “online only” or “store only.” The strongest players blend brand, space, inventory, and customer experience in different proportions.