The mattress market is often discussed like a simple retail category, but the numbers tell a much larger story: a global bedding industry worth about $120 billion, strong U.S. growth, and sprawling international operations.
The latest figures also show how a handful of leading companies are scaling revenue, distribution, and manufacturing across the world.
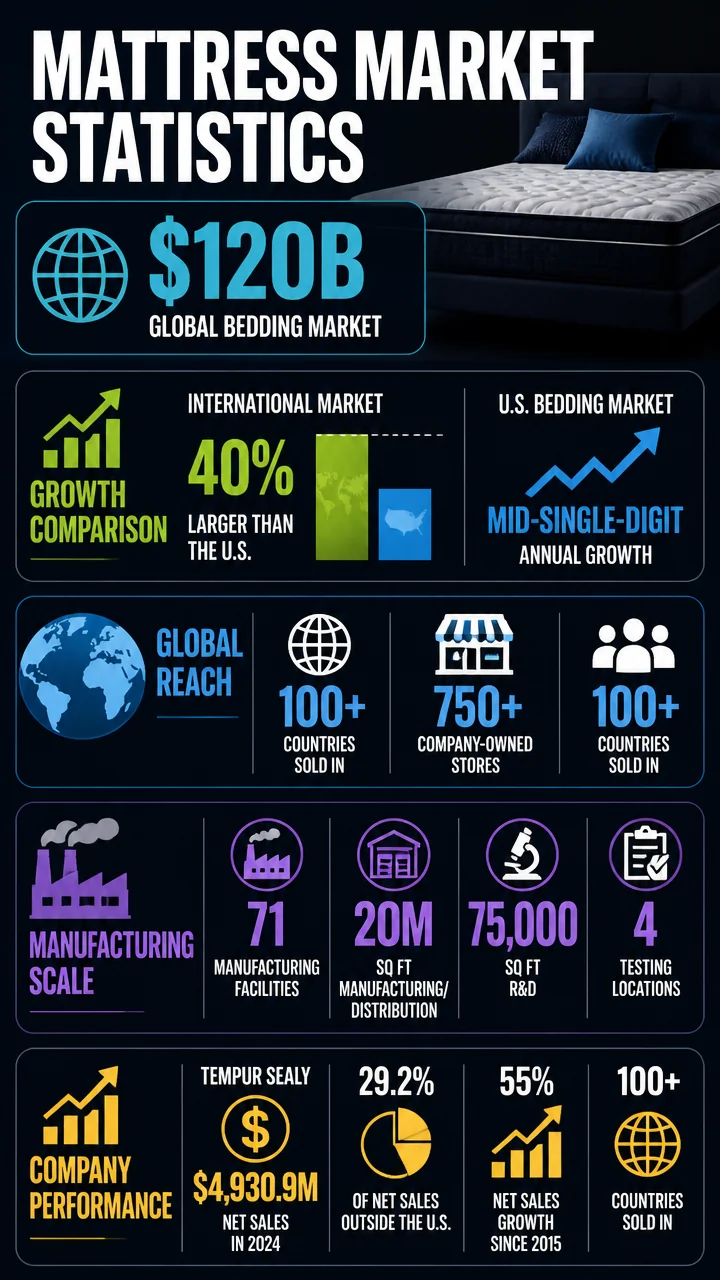
- $120 billion estimated global bedding market retail value.
- 40% larger international bedding market than the U.S. market.
- 4,930.9 million in Somnigroup 2024 net sales.
- 29.2% of Somnigroup net sales generated outside the U.S. in 2024.
- 55% growth in Tempur Sealy net sales since 2015.
- The mattress market is part of a much broader bedding economy, not just a single-product category.
- International demand is a major growth engine and is already larger than the U.S. market.
- Top operators are built on scale: manufacturing networks, direct channels, wholesale reach, and research capacity.
- Recent company data shows stable sales with improving profitability and margins.
Mattress market statistics: the big picture in 2026
The estimated global bedding market is about $120 billion in retail value, making this a large consumer category with room for global expansion.
One of the clearest takeaways from the data is that this is not a narrow domestic market: international bedding is about 40% larger than the U.S. market.
U.S. bedding averages mid-single-digit annual growth, a useful benchmark for a mature category that still has room to expand through product upgrades, omnichannel sales, and replacement cycles.
For brands and retailers, that kind of growth is attractive because it usually reflects a mix of recurring demand and premiumization.
The mattress market is large enough to support heavy infrastructure investments, but fragmented enough that distribution and brand positioning still matter.
That combination tends to reward companies that can scale efficiently across retail, wholesale, and direct-to-consumer channels.
Mattress market trends: scale, reach, and global footprint
The strongest trend in the dataset is scale.
Tempur Sealy’s business footprint alone shows how much operational capacity it takes to compete in bedding and mattresses worldwide.
- Over 100 countries worldwide receive Tempur Sealy products.
- 750+ company-owned stores give the company a broad direct retail presence.
- 71 manufacturing facilities support production and logistics.
- 20 million square feet of manufacturing and distribution operations underscore how physically intensive the category is.
- 75,000 square feet of research and development space shows the importance of product design and materials innovation.
- 4 state-of-the-art product-testing locations point to quality control as a competitive advantage.
Big number: Tempur Sealy’s network includes 31 wholly owned facilities, 9 joint venture facilities, 27 licensee facilities, and 4 Tempur-Pedic facilities.
That mix illustrates how global mattress production often relies on a blended manufacturing model.
| Tempur Sealy global network metric | Figure | What it suggests |
|---|---|---|
| Countries served | 100+ | Wide international market access |
| Company-owned stores | 750+ | Strong direct retail presence |
| Manufacturing facilities | 71 | Scale in production and supply chain |
| Manufacturing and distribution space | 20 million sq. ft. | Capital-intensive operating model |
| R&D space | 75,000 sq. ft. | Product development emphasis |
| Product-testing locations | 4 | Quality and performance validation |
Mattress market growth statistics: revenue and profit since 2015
One of the most striking patterns in the data is how sharply Tempur Sealy’s financials have expanded over the last decade.
The company’s growth rates are especially notable because they span revenue, earnings, and per-share performance—not just one line item.
- 55% growth in net sales since 2015.
- 504% growth in net income since 2015.
- 121% growth in adjusted net income since 2015.
- 99% growth in adjusted EBITDA since 2015.
- 750% growth in GAAP EPS since 2015.
- 210% growth in adjusted EPS since 2015.
Pull quote: GAAP EPS grew 750% since 2015, the standout growth figure in the dataset and a sign of major earnings transformation over time.
| Tempur Sealy metric | 2015 baseline | TTM as of Sept. 30, 2024 | Change since 2015 |
|---|---|---|---|
| Net sales | $3,151 million | $4,894 million | +55% |
| Net income | $65 million | $390 million | +504% |
| Adjusted net income | $200 million | $442 million | +121% |
| Adjusted EBITDA | $456 million | $907 million | +99% |
| GAAP EPS | $0.26 | $2.19 | +750% |
| Adjusted EPS | $0.80 | $2.48 | +210% |
Another notable figure: trailing-twelve-month net sales reached $4,894 million as of Sept.
30, 2024, up from a $3,151 million baseline in 2015.
That puts the company’s sales growth in clear context: not explosive top-line hypergrowth, but sustained expansion at scale.
Mattress market benchmarks: what Somnigroup’s 2024 results show
Somnigroup’s annual report adds another useful benchmark for the mattress market because it shows a large bedding business with nearly flat sales but improving profitability.
In other words, the market can remain stable while the earnings profile improves.
- $4,930.9 million in 2024 net sales.
- $4,925.4 million in 2023 net sales.
- $4,921.2 million in 2022 net sales.
- $2,180.1 million in 2024 gross profit.
- $634.2 million in 2024 operating income.
| Somnigroup financial metric | 2024 | 2023 | 2022 |
|---|---|---|---|
| Net sales | $4,930.9M | $4,925.4M | $4,921.2M |
| Cost of sales | $2,750.8M | $2,796.7M | $2,871.6M |
| Gross profit | $2,180.1M | $2,128.7M | $2,049.6M |
| Operating income | $634.2M | $607.2M | Not provided |
Why it matters: sales were nearly flat from 2022 to 2024, but gross profit still rose from $2,049.6 million to $2,180.1 million.
That suggests better mix, better cost discipline, or both.
Mattress market channel statistics: direct, wholesale, and Mattress Firm
Channel mix is one of the clearest ways to understand how mattress companies grow.
The dataset shows that Somnigroup relies on a multi-channel model rather than a single route to market.
- Direct channel represented 24.9% of net sales in 2024, up from 23.9% in 2023.
- Mattress Firm contributed approximately 18% of consolidated net sales in both 2024 and 2023.
- Over 10,000 wholesale customers give Tempur Sealy broad downstream reach.
- The direct channel is growing, but not dramatically.
- Mattress Firm remains a meaningful anchor customer.
- Wholesale is still essential for breadth and volume.
| Channel metric | 2024 | 2023 | Change |
|---|---|---|---|
| Direct channel share of net sales | 24.9% | 23.9% | +1.0 percentage point |
| Mattress Firm share of consolidated net sales | 18% | 18% | No change |
Pull quote: 24.9% of net sales came through the direct channel in 2024, showing how important controlled retail and customer relationship ownership remain in this market.
Mattress market geography: U.S. versus international demand
The geographic split in the dataset is especially important for SEO and market analysis because it shows that mattress demand is no longer concentrated in one country.
The market is international by default.
29.2% of Somnigroup’s net sales were generated outside the U.S. in 2024.
- International bedding is about 40% larger than the U.S. market.
- Tempur Sealy sells in over 100 countries.
- Nearly three-tenths of Somnigroup sales come from outside the U.S.
This is one of the most revealing mattress market statistics in the dataset: international demand is not a side story.
It is a structural part of the industry’s growth model.
Mattress market operations statistics: manufacturing, testing, and R&D
Mattress companies often look like consumer brands on the surface, but the underlying business is industrial.
The dataset shows that clearly through manufacturing footprint, testing infrastructure, and research capacity.
- 71 manufacturing facilities in Tempur Sealy’s network.
- 31 wholly owned facilities as part of the global manufacturing network.
- 9 joint venture facilities and 27 licensee facilities.
- 4 Tempur-Pedic facilities in the network.
- 4 product-testing locations for state-of-the-art validation.
Why it matters: In mattress manufacturing, scale is not just about output.
It also affects logistics, quality assurance, product availability, and the ability to serve different regional markets efficiently.
Mattress market leadership statistics: experience and tenure
Leadership quality is harder to measure than revenue, but the dataset gives two concrete indicators of management continuity.
- 195 years of combined TPX experience across the leadership team.
- 17 years of average TPX tenure.
Those figures suggest a seasoned leadership group with deep institutional knowledge.
In a category where supply chain execution, retail partnerships, and product cycles all matter, that kind of tenure can be a competitive asset.
Mattress market statistics by category: the most quotable numbers
Some figures stand out because they capture the market’s scale or a company’s momentum in a single line.
- $120 billion global bedding market value.
- 40% larger international bedding market than the U.S. market.
- 4,930.9 million Somnigroup 2024 net sales.
- 29.2% of sales generated outside the U.S. in 2024.
- 55% net sales growth since 2015 for Tempur Sealy.
- 504% net income growth since 2015 for Tempur Sealy.
- 750% GAAP EPS growth since 2015 for Tempur Sealy.
Pull quote: The mattress market is big, global, and operationally heavy—and the numbers show that growth is increasingly about distribution scale as much as product demand.
Mattress market data table: the strongest comparative figures in one place
| Theme | Statistic | Source signal |
|---|---|---|
| Market size | $120 billion global bedding market | Large category with global runway |
| Geography | 40% larger international bedding market vs. U.S. |
Demand is global, not domestic-only |
| Growth | Mid-single-digit annual growth in U.S. bedding | Stable mature-market expansion |
| Revenue scale | $4,930.9 million Somnigroup 2024 net sales | Multi-billion-dollar market participation |
| International sales | 29.2% of Somnigroup sales outside U.S. | Meaningful geographic diversification |
| Channel mix | 24.9% direct channel share in 2024 | Direct retail remains strategically important |
| Profitability | $634.2 million operating income in 2024 | Strong earnings base |
What these mattress market statistics reveal about the industry
Viewed together, the data points to a category that is both highly mature and still highly investable.
Mattress demand is supported by replacement purchases, comfort upgrades, brand loyalty, and multi-channel distribution, while the leading companies are increasingly global and vertically sophisticated.
- Scale is a moat: manufacturing, distribution, and retail footprints are enormous.
- Profitability can improve even when sales are flat: Somnigroup’s recent trend demonstrates that clearly.
- International exposure matters: the best-positioned players are already operating across dozens of countries.
- Direct selling is rising: the direct channel’s share increased in 2024.
- Operational discipline matters as much as brand strength: cost of sales declined from 2022 to 2024 while gross profit rose.
If you are tracking mattress market statistics for investment research, retail strategy, or SEO content planning, the main story is simple: this is a large global category where scale, channel mix, and cross-border reach shape the winners.
Mattress market statistics worth remembering
- $120 billion is the estimated global bedding market retail value.
- International bedding is about 40% larger than the U.S. market.
- U.S. bedding averages mid-single-digit annual growth.
- Tempur Sealy sells in over 100 countries.
- Tempur Sealy operates 71 manufacturing facilities.
- Somnigroup generated $4,930.9 million in net sales in 2024.
- 29.2% of Somnigroup sales came from outside the U.S. in 2024.
- Tempur Sealy’s GAAP EPS grew 750% since 2015.