Sleep deprivation is still a mainstream health issue, not a niche one.
The latest CDC data show that millions of adults, children, and workers are still falling short on sleep, with clear differences by age, race, work schedule, and location.
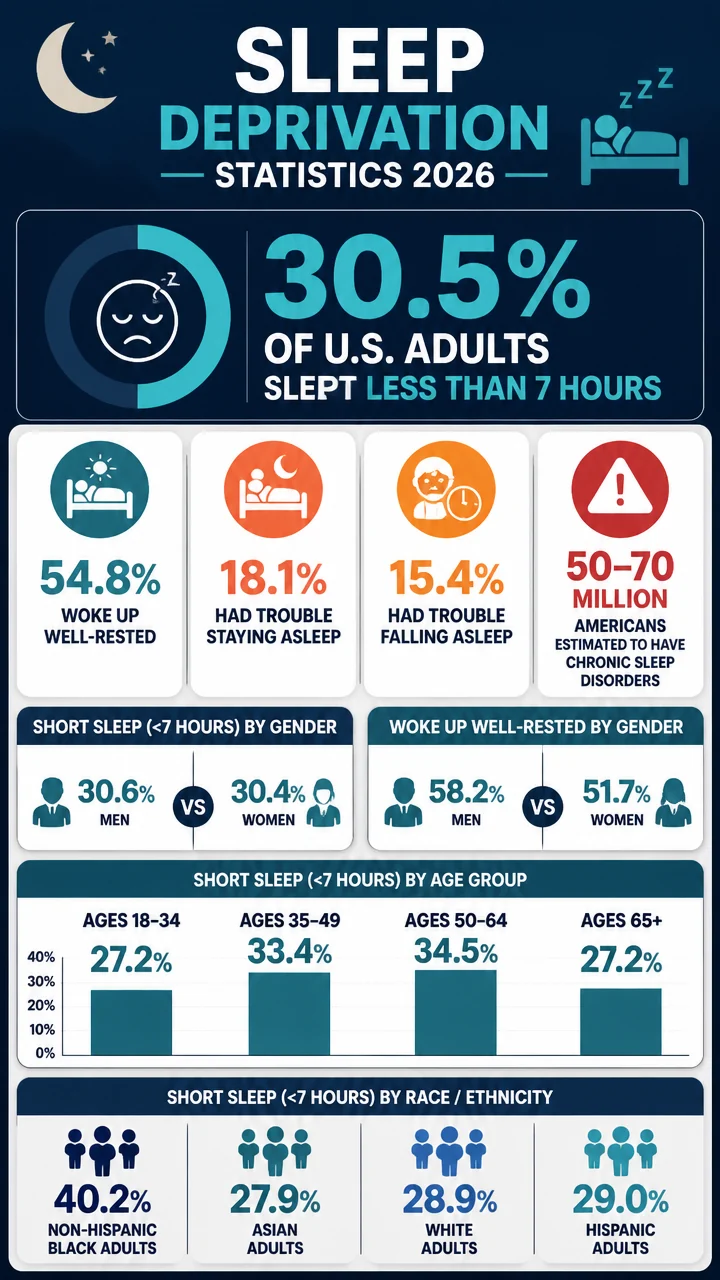
- 30.5% of U.S. adults slept less than 7 hours in 2024.
- 54.8% woke up feeling well-rested most days or every day.
- 18.1% had trouble staying asleep most days or every day.
- 50 to 70 million Americans are estimated to have chronic sleep disorders.
Table of contents
- Sleep deprivation statistics at a glance
- Sleep deprivation in U.S. adults
- Sleep deprivation by age, sex, and race
- Sleep deprivation trends and comparisons over time
- Sleep deprivation in children and adolescents
- Sleep deprivation by geography and work schedule
- Why sleep deprivation statistics matter
Sleep deprivation statistics at a glance
One in three U.S. adults is not getting the recommended amount of sleep on a regular basis, and the problem is not evenly distributed.
- 30.5% of U.S. adults slept less than 7 hours in 2024.
- 15.4% had trouble falling asleep most days or every day.
- 18.1% had trouble staying asleep most days or every day.
- 54.8% woke up feeling well-rested most days or every day.
- 35% of U.S. adults reported insufficient sleep duration in CDC Chronic Disease Indicators in 2020.
That combination matters because short sleep is only one piece of the picture.
Difficulty falling asleep, difficulty staying asleep, and not waking up refreshed all point to broader sleep quality problems that affect daily functioning.
Sleep deprivation in U.S. adults: the core numbers
30.5% of U.S. adults slept less than 7 hours on average in a 24-hour period in 2024, according to CDC NCHS Data Brief 559.
That means nearly 3 in 10 adults are below the common sleep-duration benchmark.
Sleep quality measures tell an even fuller story:
- 54.8% of adults woke up feeling well-rested most days or every day.
- 15.4% had trouble falling asleep most days or every day.
- 18.1% had trouble staying asleep most days or every day.
Short sleep and poor sleep quality can coexist.
A person may technically sleep long enough but still wake up tired or struggle to fall and stay asleep.
| 2024 adult sleep measure | Percent of U.S. adults |
|---|---|
| Slept less than 7 hours | 30.5% |
| Woke up feeling well-rested most days or every day | 54.8% |
| Trouble falling asleep most days or every day | 15.4% |
| Trouble staying asleep most days or every day | 18.1% |
Among these, trouble staying asleep stands out as the more common complaint.
It affects 18.1% of adults, compared with 15.4% who struggle to fall asleep.
Sleep deprivation statistics by age, sex, and race
Sleep deprivation doesn’t affect every group equally.
The CDC data show a pattern: middle-aged adults, women on certain sleep-quality measures, and non-Hispanic Black adults report some of the highest burdens.
Age differences in short sleep
Adults ages 50 to 64 were the most likely to sleep less than 7 hours in 2024, at 34.5%.
Adults ages 35 to 49 followed closely at 33.4%.
| Age group | Slept less than 7 hours in 2024 | Well-rested most days or every day | Trouble falling asleep | Trouble staying asleep |
|---|---|---|---|---|
| 18 to 34 | 27.2% | 52.2% | 18.3% | 12.7% |
| 35 to 49 | 33.4% | 50.1% | 15.4% | 16.9% |
| 50 to 64 | 34.5% | 54.5% | 14.5% | 22.3% |
| 65 and older | 27.2% | 63.5% | 12.8% | 21.7% |
- 50 to 64 is the highest short-sleep group at 34.5%.
- 65 and older had the highest well-rested rate at 63.5%.
- Adults 18 to 34 had the highest trouble-falling-asleep rate at 18.3%.
- Adults 50 to 64 had the highest trouble-staying-asleep rate at 22.3%.
Big number: the gap between the highest and lowest trouble-staying-asleep rates across age groups is 9.6 percentage points (22.3% vs.
12.7%).
Sex differences in sleep deprivation
The gender split is small for short sleep, but more pronounced for sleep quality.
- 30.6% of men slept less than 7 hours in 2024.
- 30.4% of women slept less than 7 hours in 2024.
- 58.2% of men woke up feeling well-rested most days or every day.
- 51.7% of women woke up feeling well-rested most days or every day.
- 12.2% of men had trouble falling asleep most days or every day.
- 18.5% of women had trouble falling asleep most days or every day.
- 14.6% of men had trouble staying asleep most days or every day.
- 21.4% of women had trouble staying asleep most days or every day.
Women reported more sleep difficulties than men across every sleep-quality measure in 2024.
That gap is especially clear for trouble staying asleep, where women exceeded men by 6.8 percentage points.
Race and ethnicity differences
Race and ethnicity show some of the sharpest disparities in the dataset.
Non-Hispanic Black adults reported the highest short-sleep prevalence, while non-Hispanic Asian adults generally reported the lowest levels of sleep difficulty.
| Race/ethnicity | Slept less than 7 hours | Well-rested most days or every day | Trouble falling asleep | Trouble staying asleep |
|---|---|---|---|---|
| Non-Hispanic Asian | 27.9% | 61.5% | 9.0% | 9.2% |
| Non-Hispanic Black | 40.2% | 51.4% | 15.5% | 16.7% |
| Non-Hispanic White | 28.9% | 55.3% | 16.1% | 20.7% |
| Hispanic | 29.0% | 57.6% | 14.1% | 12.5% |
- 40.2% of non-Hispanic Black adults slept less than 7 hours — the highest rate in the group.
- 27.9% of non-Hispanic Asian adults slept less than 7 hours — the lowest rate listed.
- 61.5% of non-Hispanic Asian adults woke up feeling well-rested most days or every day.
- 20.7% of non-Hispanic White adults had trouble staying asleep, the highest in that measure.
Fast fact: the short-sleep gap between non-Hispanic Black and non-Hispanic Asian adults is 12.3 percentage points.
Sleep deprivation trends and comparisons over time
The most useful trend data in the dataset suggest that sleep deprivation has remained stubbornly persistent rather than dramatically improving.
- From 2013 to 2022, the percentage of adults not getting enough sleep stayed the same.
- In 2020, 35% of U.S. adults reported insufficient sleep duration.
- In 2024, 30.5% of adults slept less than 7 hours on average.
The metrics are not perfectly interchangeable, but they point in the same direction: short sleep remains common, and the problem has not meaningfully disappeared.
Historical CDC data also show how sleep trouble varied in earlier years and among workers:
| Year / group | Sleep statistic |
|---|---|
| 2020, U.S. adults | 17.8% had trouble falling asleep most days or every day in the past 30 days |
| 2020, U.S. adults | 22.1% had trouble staying asleep most days or every day in the past 30 days |
| 2010, employed civilian workers | 30.0% reported short sleep duration of 6 hours or less per day |
| 2010, regular night-shift workers | 44.0% reported short sleep duration |
| 2010, day-shift workers | 28.8% reported short sleep duration |
Notable comparison: regular night-shift workers in 2010 had a short-sleep rate of 44.0%, far above regular daytime workers at 28.8%.
Sleep deprivation in children and adolescents
Sleep deprivation is not only an adult issue.
CDC MMWR data show that more than one-third of U.S. children and adolescents ages 4 months to 17 years slept less than recommended between 2016 and 2018.
- 34.9% of U.S. children and adolescents ages 4 months to 17 years slept less than recommended.
- 40.3% of infants ages 4 to 11 months had short sleep duration.
- 37.4% of children ages 6 to 12 years had short sleep duration.
- 31.2% of adolescents ages 13 to 17 years had short sleep duration.
| Age group | Short sleep duration | Regular bedtime |
|---|---|---|
| 4 months to 17 years | 34.9% | 33.9% |
| 4 to 11 months | 40.3% | 43.5% |
| 1 to 2 years | 33.3% | Not provided |
| 3 to 5 years | 34.8% | Not provided |
| 6 to 12 years | 37.4% | Not provided |
| 13 to 17 years | 31.2% | 23.8% |
What stands out: sleep shortfall is highest in infancy, but adolescents have the weakest bedtime regularity, with only 23.8% having a regular bedtime.
Sleep deprivation by geography and place of residence
Geography matters too.
In 2022, the prevalence of insufficient sleep in U.S. adults ranged from 30% in Vermont to 46% in Hawaii.
Local and county-level comparisons show an even wider spread:
| Geographic measure | Lowest | Highest |
|---|---|---|
| State-level insufficient sleep in adults, 2022 | Vermont: 30% | Hawaii: 46% |
| County-level short sleep prevalence, 2020 | Boulder County, Colorado: 23.8% | Greene County, Alabama: 48.4% |
The county data imply a spread of 24.6 percentage points between the lowest and highest locations listed.
Urban-rural differences
In 2020, sleep trouble was generally more common outside large central metro areas.
- 22.4% of adults in nonmetropolitan areas had trouble falling asleep.
- 22.4% of adults in nonmetropolitan areas had trouble staying asleep.
- 19.2% of adults in medium and small metropolitan areas had trouble falling asleep.
- 17.6% of adults in large fringe metropolitan areas had trouble falling asleep.
- 14.4% of adults in large central metropolitan areas had trouble falling asleep.
- 14.4% of adults in large central metropolitan areas had trouble staying asleep.
Why it matters: the geographic split suggests that sleep deprivation is not just a personal health issue; it is also shaped by place, access, and daily environment.
Sleep deprivation statistics by work schedule and occupation
Work schedule remains one of the strongest predictors of short sleep.
The CDC’s worker data show a clear penalty for night shifts.
| Worker group, 2010 | Short sleep duration |
|---|---|
| Regular night shifts | 44.0% |
| Other shifts | 31.6% |
| Employed civilian workers overall | 30.0% |
| Regular daytime shifts | 28.8% |
| Manufacturing workers | 34.1% |
- 2.2 million night shift workers reported short sleep duration.
- Night shift workers had the highest short-sleep rate listed at 44.0%.
- Manufacturing workers also stood out at 34.1%.
Pull quote: Night shift work was associated with the highest short-sleep burden in the worker data.
Sleep deprivation and health risk indicators
Sleep deprivation is not only about feeling tired the next day.
It also connects to safety and long-term health burden.
- About 20% of vehicle crashes are linked to drowsy driving.
- Nearly 40% of adults fall asleep during the day without meaning to at least once a month.
- 50 to 70 million Americans are estimated to have chronic sleep disorders.
Those figures suggest that sleep deprivation has a broad downstream effect: it can influence road safety, daytime alertness, productivity, and demand for medical care.
For employers, educators, and health professionals, the practical takeaway is simple: sleep is not a minor lifestyle variable.
It is a measurable population-level issue with real-world consequences.
Most notable sleep deprivation benchmarks to remember
- 30.5% of U.S. adults slept less than 7 hours in 2024.
- 40.2% of non-Hispanic Black adults slept less than 7 hours.
- 34.5% of adults ages 50 to 64 slept less than 7 hours.
- 18.1% of adults had trouble staying asleep most days or every day.
- 63.5% of adults ages 65 and older woke up feeling well-rested most days or every day.
- 44.0% of regular night-shift workers reported short sleep duration.
- 48.4% short sleep prevalence was recorded in Greene County, Alabama, the highest county listed.
Sleep deprivation statistics point to a durable, uneven public health problem: common overall, worse in certain populations, and strongly affected by work and geography.