Bedroom furniture market statistics at a glance
Bedroom furniture demand is being shaped by a mix of pricing pressure, omnichannel shopping, and strong repeat-purchase behavior.
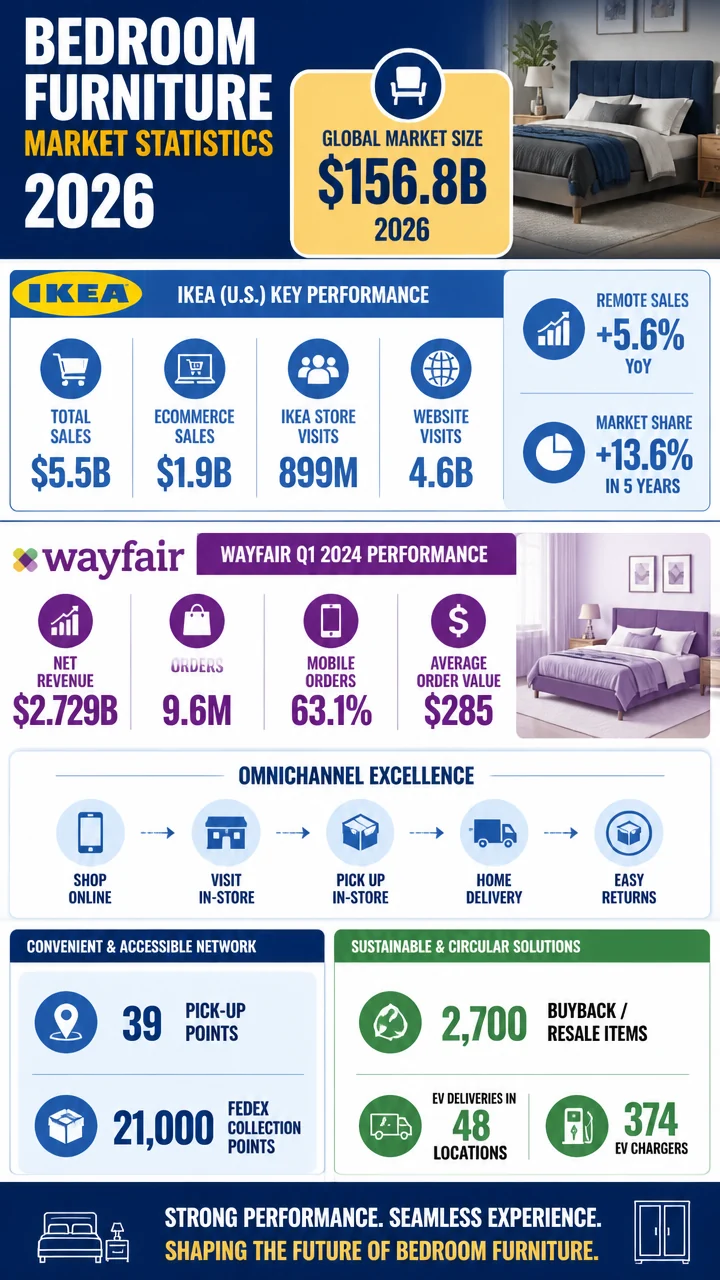
The latest retail data from IKEA and Wayfair shows how consumers are browsing more, buying across more channels, and responding to value-led offers.
Big number: IKEA stores welcomed 899 million visitors in FY24, while its website drew 4.6 billion visits.
Fast fact: Wayfair delivered 9.6 million orders in Q1 2024, and 63.1% were placed via mobile.
Why it matters: Bedroom furniture shopping is no longer just a store purchase; it is increasingly a digital-first, price-sensitive, repeat-visit category.
Table of contents
- Market overview and retail scale
- Bedroom furniture ecommerce and omnichannel trends
- Pricing, traffic, and basket behavior
- Customer loyalty and repeat purchasing
- Sustainability, services, and delivery benchmarks
- Global furniture market context
Bedroom furniture market trends: what the biggest retailers reveal
Bedroom furniture is part of a broader home furnishings market, but the supplied numbers point to a clear pattern: shoppers are comparing options more often, buying across online and physical channels, and reacting quickly to price changes.
- IKEA U.S. ended FY24 with $5.5 billion in total sales.
- IKEA U.S. recorded $1.9 billion in ecommerce sales.
- Wayfair generated $2.729 billion in net revenue in Q1 2024.
- Wayfair’s average order value was $285 in Q4 2023 and $285 again in Q1 2024.
Market signal: large furniture retailers are still moving serious volume, but the customer journey is increasingly spread across digital discovery, pickup points, and delivery networks.
Key takeaway: The bedroom furniture market is being pulled toward convenience.
Shoppers want choice, price clarity, and fulfillment options that reduce friction.
Bedroom furniture ecommerce statistics and channel mix
Online shopping is central to modern furniture buying, and the retail data here shows that digital is not just a support channel anymore.
It is a major driver of reach, intent, and conversion.
| Metric | FY24 / Q1 2024 figure | What it suggests |
|---|---|---|
| IKEA global retail sales sold online | 26% | Online is a substantial share of furniture purchasing |
| IKEA global retail sales sold through stores | 71% | Stores still anchor the category |
| IKEA sales from services | 3% | Services are a smaller but meaningful add-on |
| IKEA website visits | 4.6 billion | Massive digital demand funnel |
| IKEA website visits YoY change | +21% | Digital traffic is accelerating |
| Wayfair orders placed via mobile | 63.1% | Mobile is the dominant shopping device |
At a glance: IKEA’s global channel split shows stores still lead, but 26% online is too large to treat as secondary.
Wayfair’s mobile share underscores how quickly shoppers are researching and placing orders on phones.
IKEA’s website visits climbed from 3.8 billion in FY23 to 4.6 billion in FY24, a gain of 21%.
That growth matters because bedroom furniture is often a high-consideration category: shoppers compare dimensions, finishes, mattresses, storage options, and delivery timing before they buy.
Wayfair’s data tells a similar story about digital convenience.
The company had 22.3 million active customers as of March 31, 2024, delivered 9.6 million orders in Q1, and saw repeat customers account for 80.5% of total orders delivered.
Pull quote: 63.1% of Wayfair’s Q1 2024 orders were placed via mobile device, a strong sign that furniture shopping is increasingly happening in the palm of the customer’s hand.
Bedroom furniture market pricing and basket-size benchmarks
Pricing is one of the clearest levers in furniture retail, and the dataset includes direct evidence that lower prices are changing shopping behavior.
- IKEA lowered wholesale prices to retailers by an average of 10% globally in FY24.
- IKEA said the full-year effect of those price reductions was 15%.
- IKEA U.S. increased pieces purchased per basket by 2.7% after reintroducing New Lower Prices.
- Wayfair’s average order value was $276 in Q4 2023 and $285 in Q1 2024.
Why it matters: Bedroom furniture is highly sensitive to value framing.
When prices drop or are presented more clearly, shoppers appear willing to add more pieces to the basket.
IKEA U.S. data is especially telling.
A 2.7% increase in pieces purchased per basket suggests that lower prices do more than shift sentiment; they can directly change basket composition.
For bedroom shoppers, that may mean adding a bed frame, storage, lighting, or accessories together rather than purchasing a single item.
Wayfair’s average order value rising from $276 to $285 across the two reporting periods also points to stable spending behavior despite a volatile retail backdrop.
Key takeaway: In bedroom furniture, price changes can influence not only conversion but also basket expansion and add-on behavior.
Bedroom furniture customer behavior: repeat buyers, loyalty, and order frequency
The furniture market is often thought of as occasional and replacement-driven, but the retailer data shows meaningful repeat behavior, especially online.
| Customer metric | Wayfair Q4 2023 | Wayfair Q1 2024 | Direction |
|---|---|---|---|
| Active customers | 22.4 million | 22.3 million | Slightly lower |
| Orders per customer | 1.84 | 1.84 | Flat |
| Repeat customers’ share of total orders | 79.4% | 80.5% | Up |
| Repeat customer orders | 9.0 million | 7.7 million | Lower in Q1 |
| LTM net revenue per active customer | $537 | $537 | Flat |
Several takeaways stand out:
- Wayfair’s customer base stayed stable at about 22 million active customers.
- Orders per customer held at 1.84, suggesting consistent purchase frequency.
- Repeat customers were responsible for more than four-fifths of orders in Q1 2024.
- LTM net revenue per active customer stayed at $537, which indicates steady customer value.
Fast fact: 80.5% of Wayfair’s total orders delivered in Q1 2024 came from repeat customers.
For the bedroom furniture market, this is important because repeat purchases can come from upgrades, matched room sets, storage additions, or adjacent home purchases.
The market is not limited to one-time bedroom resets; it also benefits from returning customers who already know the brand and ordering process.
Bedroom furniture market growth statistics: traffic, reach, and store expansion
Retail expansion remains an important growth signal, especially for a category where many shoppers still want to see materials, scale, and finishes in person.
- IKEA opened 56 new sales locations in the past year.
- IKEA U.S. announced eight new format stores opening across the U.S. in 2025.
- IKEA U.S. planned seven new Plan & order points with Pick-up in 2025.
- IKEA U.S. had 39 existing pick-up points across the country in FY24.
- IKEA U.S. had 21,000 FedEx collection points across the country in FY24.
Why it matters: Bedroom furniture buyers often need delivery flexibility because items are bulky, sometimes multi-piece, and frequently tied to room renovation timelines.
Pickup points and order-planning locations reduce the friction between browsing and purchase.
IKEA’s expansion into more sales locations and pickup infrastructure suggests a continued focus on making the shopping journey easier.
The brand also planned one new pickup point in Santa Monica, California, reinforcing the value of local convenience in dense urban markets.
Big number: IKEA U.S. operated 39 pickup points and 21,000 FedEx collection points in FY24, showing how widely distributed fulfillment options have become.
Bedroom furniture demographics and market access signals
While the dataset does not provide age or income segmentation, it does reveal market-access signals that matter for broader bedroom furniture demand.
- IKEA U.S. launched a Spanish-language website in July 2024.
- IKEA U.S. launched its first buy now, pay later program with Afterpay in FY24.
- IKEA U.S. increased products eligible for buyback and resale to 2,700 items.
- IKEA U.S. sold nearly 185,000 Plant Dogs in FY24.
These figures point to a market that is broadening access and broadening the shopping experience at the same time.
A Spanish-language website can improve reach, BNPL can lower the upfront barrier for larger bedroom purchases, and buyback/resale support can appeal to shoppers who want affordability or sustainability.
Why it matters: Bedroom furniture is expensive enough that financing and resale options can influence purchase timing and overall basket size.
Bedroom furniture sustainability and delivery benchmarks
Delivery and sustainability are increasingly part of furniture purchasing decisions, especially for larger items like beds, wardrobes, and storage systems.
| Sustainability and fulfillment metric | FY24 figure | What it indicates |
|---|---|---|
| Electric delivery vehicle locations | 48 | Growing low-emission delivery footprint |
| EV chargers installed at stores | 374 | Support for electrified logistics |
| Zero-emission delivery growth since FY23 | More than 90% | Rapid improvement in delivery emissions performance |
| Buyback and resale eligible items | 2,700 | Circular economy expansion |
IKEA U.S. also sold nearly 185,000 Plant Dogs in FY24, a small but memorable sign that add-on products still matter in the home category.
Bedroom shoppers often buy accessories alongside primary furniture, so small-ticket add-ons can signal broader category engagement.
Fast fact: IKEA U.S. boosted zero-emission deliveries in the U.S. by more than 90% since FY23, showing how quickly delivery fleets can shift when the business prioritizes them.
Bedroom furniture industry data: the global IKEA picture
The global IKEA numbers help frame the scale of the furniture market behind the bedroom category.
Even when consumer spending is pressured, IKEA remains one of the clearest indicators of how shoppers behave across home furnishings.
- Global retail sales in FY24 totaled EUR 45.1 billion.
- Global retail sales fell 5.3% versus FY23.
- Currency-adjusted sales were down 4.0%.
- 71% of FY24 IKEA products were sold through stores.
- 26% were sold online.
- 3% came from services to customers.
- IKEA stores welcomed 899 million visitors.
- The website reached 4.6 billion visits.
- Retail operations span 63 markets.
Key takeaway: The global business is still store-led, but online traffic is enormous and growing.
That combination is especially relevant for bedroom furniture, where shoppers may research online and close the sale in store or through pickup-based fulfillment.
IKEA also employed 216,000 co-workers worldwide in FY24, down from 219,000 in FY23.
That slight decline is worth noting alongside sales pressure and price reductions because it suggests the company is managing scale carefully while adjusting to a softer top line.
Global furniture market comparisons: IKEA vs. Wayfair
The two companies in this dataset are not direct apples-to-apples comparables, but their numbers show very different roles in the furniture ecosystem.
| Company | Latest revenue figure | Customer / traffic signal | Channel insight |
|---|---|---|---|
| IKEA U.S. | $5.5 billion total sales | 4.6 billion website visits globally | Omnichannel with dense pickup and store network |
| IKEA global | EUR 45.1 billion retail sales | 899 million store visitors | Store-first but heavily digital-supported |
| Wayfair | $2.729 billion net revenue in Q1 2024 | 22.3 million active customers | Digital-native, mobile-heavy shopping behavior |
Seen together, the data suggests a market split between an established retail giant with store infrastructure and a digital-native operator built on customer frequency and online convenience.
Bedroom furniture buyers can move between these models depending on whether they value tactile shopping, delivery flexibility, or price comparison.
Pull quote: IKEA’s global operations span 63 markets, while Wayfair’s Q1 2024 order mix shows 63.1% mobile placement — two different forms of scale, both tied to convenience.
Bedroom furniture market statistics worth quoting
If you only remember a few numbers from this dataset, these are the ones that best capture the current state of the bedroom furniture market:
- 4.6 billion IKEA website visits in FY24.
- 899 million IKEA store visitors in FY24.
- 26% of IKEA global sales sold online.
- $1.9 billion in IKEA U.S. ecommerce sales.
- 80.5% of Wayfair orders delivered in Q1 2024 came from repeat customers.
- 63.1% of Wayfair orders were placed via mobile.
- 10% average global wholesale price reduction at IKEA in FY24.
- 2.7% increase in IKEA U.S. pieces purchased per basket after New Lower Prices.
- More than 90% increase in zero-emission deliveries since FY23 for IKEA U.S.
For SEO and editorial purposes, those figures point to the themes most likely to resonate with readers researching bedroom furniture market statistics: demand scale, online growth, basket behavior, delivery convenience, and price sensitivity.
At a glance: The bedroom furniture market is being reshaped less by one dramatic shift and more by several compounding ones: more visits, more mobile orders, more pickup options, and stronger reactions to lower prices.
Bedroom furniture benchmarks for brands, retailers, and shoppers
For brands and retailers, the numbers suggest a few practical benchmarks worth tracking closely:
- Digital traffic growth: IKEA’s website visits rose 21% year over year.
- Store traffic resilience: IKEA store visits rose 4.5% year over year.
- Customer retention: Wayfair’s repeat customers generated 80.5% of orders in Q1 2024.
- Fulfillment flexibility: IKEA U.S. had 39 pickup points and 21,000 FedEx collection points.
- Price response: IKEA U.S. saw a 2.7% lift in pieces per basket after pricing changes.
For shoppers, the same data suggests a category that increasingly rewards comparison, patience, and flexibility.
The best-value bedroom purchases may come from timing, bundle decisions, and choosing the right mix of store, pickup, and delivery options.
For the market overall, the message is clear: bedroom furniture is still a large, store-friendly category, but its future will be shaped by ecommerce growth, mobile-first discovery, and lower-friction fulfillment models.