Sleep quality statistics paint a sharper picture than sleep duration alone: many adults are still getting enough hours on paper, yet large shares say they wake unrested, struggle to stay asleep, or rate their sleep poorly.
The latest data also shows sleep is tightly linked to well-being, productivity, and flourishing.
Sleep quality statistics at a glance
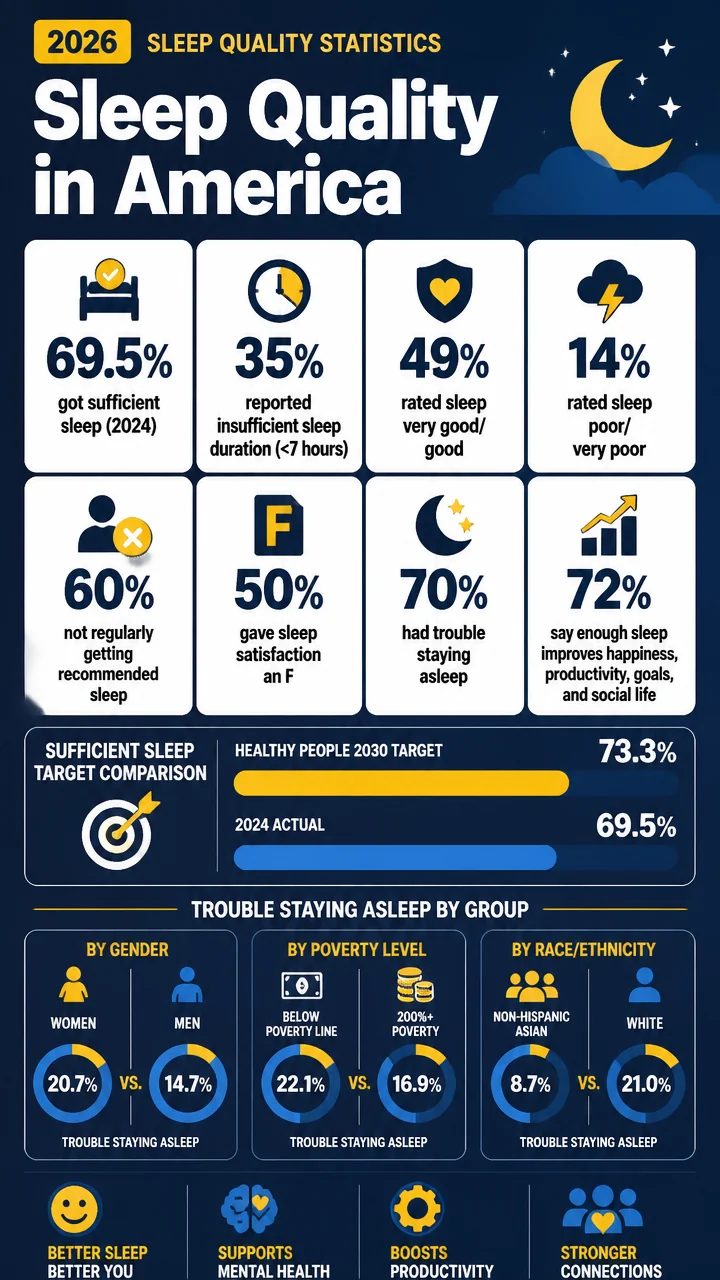
- 69.5% of U.S. adults age 18 and older got sufficient sleep in 2024.
- 35% of adults reported insufficient sleep duration in 2020.
- 49% rated their sleep quality as very good or good in a 2024 SSRS poll.
- 14% rated their sleep quality as poor or very poor.
- 60% of adults in NSF’s 2025 poll were not regularly getting the recommended amount of sleep.
- 50% received an overall F grade for sleep satisfaction.
- 72% said enough sleep positively affects happiness, productivity, goals, and social life.
Table of contents
- Sleep quality statistics: the headline trends
- Sleep duration vs. sleep quality
- Demographic differences in sleep quality
- How sleep quality connects to flourishing
- Teen sleep quality statistics
- What the latest sleep polls reveal
Sleep quality statistics: the headline trends
The broad trend is clear: sleep is still a challenge for a large share of the population, and the problem shows up in both duration and quality measures.
CDC data, survey ratings, and sleep-health polling all point in the same direction—many adults are not experiencing the kind of sleep that feels restorative.
Healthy People 2030 set a target of 73.3% of adults getting enough sleep, which gives a useful benchmark for the national conversation.
The baseline was 72.3% in 2020, but the CDC FastStats figure for 2024 shows 69.5% of adults got sufficient sleep, leaving the country below the target and below the earlier baseline.
Key trend signals
- The share of adults getting sufficient sleep in 2024 was 69.5%.
- 35% of adults reported insufficient sleep duration in 2020.
- 14.5% had trouble falling asleep most days or every day in the prior 30 days.
- 17.8% had trouble staying asleep most days or every day in the prior 30 days.
That gap between duration and experience is important.
Someone can technically sleep long enough and still wake up feeling dissatisfied, unrested, or repeatedly interrupted during the night.
Sleep quality statistics vs. sleep duration
One of the most useful ways to read sleep quality statistics is to compare how many people get enough hours versus how many say they actually sleep well.
The numbers suggest that time in bed is only part of the story.
| Measure | Figure | Year / source |
|---|---|---|
| Sufficient sleep among U.S. adults | 69.5% | 2024, CDC FastStats |
| Healthy People 2030 target | 73.3% | Target |
| Healthy People 2030 baseline | 72.3% | 2020 |
| Insufficient sleep duration | 35% | 2020, CDC |
| Trouble falling asleep most days or every day | 14.5% | 2020, CDC |
| Trouble staying asleep most days or every day | 17.8% | 2020, CDC |
The difference is small, but it matters.
Sleep maintenance problems are a major clue that sleep quality issues may persist even among people who do manage to fall asleep.
Sleep quality statistics by rating and self-assessment
Self-reported sleep quality adds another layer.
In SSRS’s 2024 poll, only about half of U.S. adults said their sleep was genuinely good.
- 49% rated their sleep quality as very good or good.
- 37% rated it fair.
- 14% rated it poor or very poor.
Hours slept also shaped how people judged their sleep:
| Sleep duration group | Rated sleep quality very good or good |
|---|---|
| 8 hours or more | 70% |
| 7 hours | 56% |
| 6 hours or less | 33% |
This is one of the clearest patterns in the data.
The more sleep people get, the more likely they are to describe it positively.
- Adults sleeping 8 hours or more were the most likely to rate sleep well at 70%.
- Adults sleeping 6 hours or less were the least likely at 33%.
- Those sleeping 7 hours landed in the middle at 56%.
Sleep quality statistics by demographics
Sleep quality is not evenly distributed.
CDC and SSRS data show meaningful differences by sex, race and ethnicity, and income.
Race, ethnicity, sex, and income differences
| Group | Trouble staying asleep most days/every day | Source year |
|---|---|---|
| Non-Hispanic Asian adults | 8.7% | 2020 |
| Men | 14.7% | 2020 |
| Adults at 200% or more of the federal poverty level | 16.9% | 2020 |
| Adults at 100% to 199% of the federal poverty level | 18.8% | 2020 |
| Non-Hispanic White adults | 21.0% | 2020 |
| Women | 20.7% | 2020 |
| Adults below 100% of the federal poverty level | 22.1% | 2020 |
The sex split is also notable.
CDC data found women at 20.7% and men at 14.7% for trouble staying asleep.
SSRS’s 2024 poll similarly found men were more likely than women to rate their sleep as very good or good, 56% versus 43%.
Income shows another consistent pattern: trouble staying asleep was lower as income rose.
- 22.1% for adults below 100% of the federal poverty level.
- 18.8% for adults at 100% to 199% of the federal poverty level.
- 16.9% for adults at 200% or more of the federal poverty level.
Sleep quality statistics and flourishing
One of the strongest findings in the dataset is how closely sleep quality tracks with flourishing, satisfaction, and perceived life benefits.
NSF’s 2025 poll makes that link unmistakable.
| Sleep-related measure | Flourishing rate |
|---|---|
| Good sleep satisfaction | 88% |
| High healthy sleep behaviors | 76% |
| No difficulty falling asleep | 72% |
| Good sleep health | 72% |
| Consistently slept recommended duration | 66% |
| Mild trouble falling asleep | 63% |
| Mild trouble staying asleep | 61% |
| More severe trouble staying asleep | 55% |
| More severe trouble falling asleep | 49% |
| Poor sleep health | 46% |
| Low sleep satisfaction | 47% |
The standout figure here is the 88% flourishing rate among adults with good sleep satisfaction.
That is far above the 47% flourishing rate among those with low sleep satisfaction.
- Good sleep satisfaction: 88% flourishing
- Low sleep satisfaction: 47% flourishing
- Good sleep health: 72% flourishing
- Poor sleep health: 46% flourishing
NSF also found that many adults recognize the life impact of sleep.
72% said getting enough sleep has a positive effect across happiness, productivity, goals, and social life, while 75% said the same about good-quality sleep.
The gender and age splits suggest these perceptions are not identical across groups:
- Women were more likely than men to report positive benefits of enough sleep on flourishing, 75% versus 69%.
- Women were more likely than men to report positive benefits of good-quality sleep on flourishing, 78% versus 72%.
- Adults ages 18 to 30 were more likely than adults 65 and older to report benefits of good-quality sleep on flourishing, 77% versus 68%.
Sleep quality statistics from NSF’s 2025 poll
NSF’s 2025 Sleep in America poll gives one of the clearest snapshots of where Americans struggle most: not just with hours, but with the experience of sleep itself.
- 60% were not regularly getting the NSF-recommended amount of sleep per night.
- 68% had some difficulty falling asleep.
- 70% had some difficulty staying asleep.
- 50% received an overall F grade for sleep satisfaction.
- 37% were dissatisfied with their sleep.
- 38% did not feel refreshed upon waking.
- 46% woke up somewhat often or more during the night.
- Over one-third received an F for practicing healthy sleep behaviors.
Behavior habits that may support sleep quality
NSF also measured a few habit markers that can influence sleep routines:
- 61% spent at least 30 minutes in bright outdoor or equivalent light 6 or 7 days per week.
- Only 17% put electronic devices away an hour before bed 6 or more days per week.
That device figure stands out as one of the weakest habit numbers in the dataset.
It suggests bedtime screen habits remain stubbornly hard to change even when adults understand sleep’s importance.
Sleep quality statistics for teens
Teen sleep quality is especially concerning.
NSF’s 2024 teen poll shows lower satisfaction, weak sleep habits, and clear emotional fallout when sleep drops.
| Teen sleep measure | Figure |
|---|---|
| Rated sleep quality excellent or very good | 30% |
| Sleep quality subindex | 65 / 100 |
| Received an A or B for recommended sleep behaviors | 21% |
| Received an F for recommended sleep behaviors | 32% |
| Took a sleep medication at least once in the past week | 17% |
| Talked with a doctor about sleep problems | 12% |
| Had a diagnosed sleep disorder | 4% |
Teen device habits also stand out.
61% did not put electronic devices away an hour before bedtime at all.
How teens say poor sleep affects emotional well-being
- 73% said their emotional well-being was negatively impacted when they slept less than usual.
- 15% said the impact was very negative.
- 58% said their emotional well-being was negatively impacted overall.
- 27% said there was no negative impact.
These figures make the emotional cost of teen sleep loss hard to ignore.
Sleep quality is not just a wellness metric; for teens, it is part of how they feel, function, and recover day to day.
What sleep quality statistics suggest about public health
Across CDC, SSRS, NSF, and Gallup data, the biggest pattern is consistency: better sleep quality is linked to better self-rated well-being, and worse sleep quality is linked to more problems in daily life.
The numbers also show that sleep issues are common enough to matter at the population level.
- Sleep quality is often weaker than sleep duration data alone suggests.
- Sleep satisfaction, sleep health, and flourishing move together.
- Women report more sleep disruption in some measures, while men are more likely to rate sleep positively in SSRS data.
- Income differences appear in trouble staying asleep, with higher poverty linked to worse sleep.
- Teens show especially low sleep-quality ratings and strong emotional effects from sleep loss.
Gallup’s 2023 survey adds an important final layer: people who rate their mental health as excellent or very good are six times more likely to get high-quality sleep than those who rate it fair or poor.
That is a dramatic reminder that sleep quality and mental health are deeply intertwined.
Sleep quality statistics sources used in this article
- CDC FastStats: Sleep Health
- Healthy People 2030 SH-03
- CDC Chronic Disease Indicators: Sleep
- CDC NCHS Data Brief 436
- SSRS: How the American Public Sleeps
- Gallup: Sleep Temperature Linked to Overall Sleep Quality
- NSF 2025 Sleep in America Poll
- NSF 2024 Sleep in America Poll