Wardrobes are bigger, busier, and more underused than most people think.
The latest wardrobe statistics show how clothing ownership, fabric mix, and unworn items vary across countries, genders, and age groups.
Key takeaways
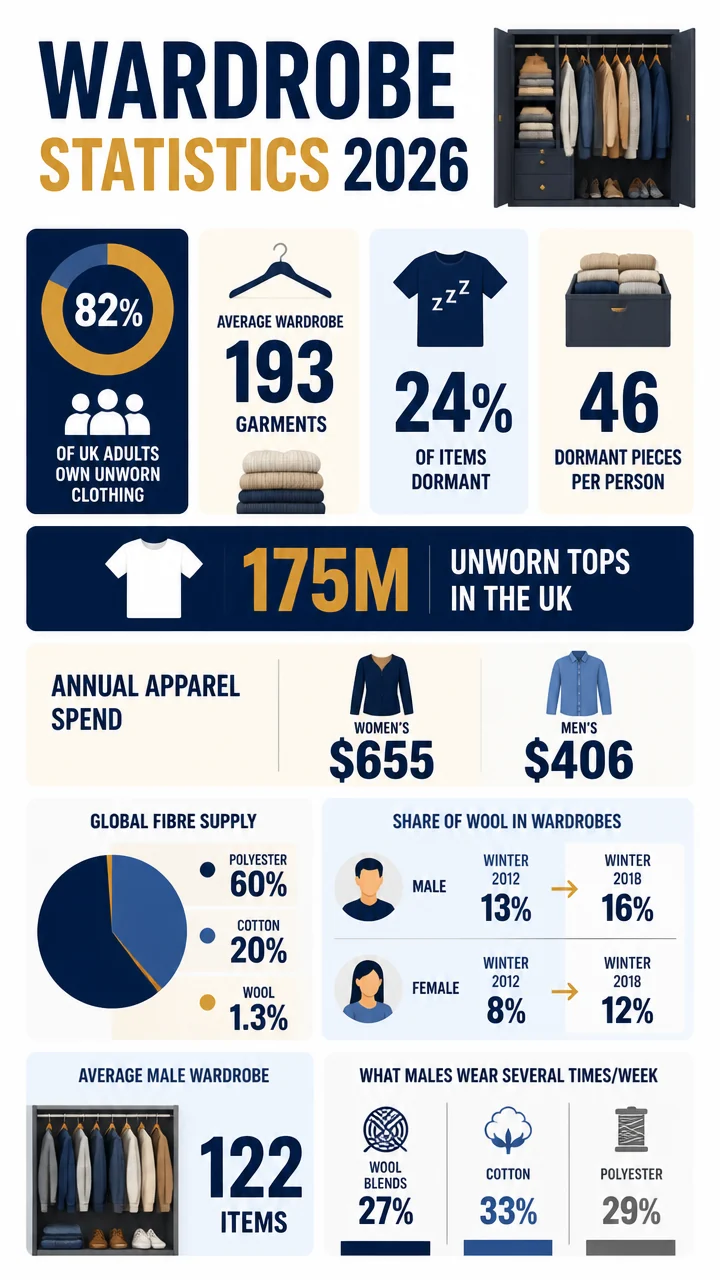
- UK adults owned 82% at least one item they had not worn in the last 12 months.
- In a wardrobe audit, the average closet held 193 garments, with 24% dormant.
- Male wardrobe wool share rose from 13% to 16% between winter 2012 and winter 2018.
- Women’s apparel spending averaged $655 per household in 2023, compared with $406 for men’s apparel.
Wardrobe statistics at a glance
If you want the fastest read on wardrobe statistics, the data points in one direction: people own a lot of clothing, but a meaningful share sits unused.
That gap shows up across surveys of everyday wardrobes, national spending patterns, and fiber preferences.
At a glance
- 193 garments: average wardrobe size in a circular-economy audit.
- 46 pieces: average dormant clothing per person in that audit.
- 175 million tops: estimated unworn tops in the UK based on average ownership.
- 60%: polyester’s share of global fibre supply in the Woolmark framing.
- 5 times higher: apparel prices in 2024 versus a century earlier, according to BLS.
| Metric | Statistic | What it suggests |
|---|---|---|
| Average wardrobe size | 193 garments | Closets are often larger than people expect |
| Dormant wardrobe share | 24% | Nearly one in four items was not worn in the last year |
| UK adults with unworn clothing | 82% | Unworn clothing is the norm, not the exception |
| Women’s apparel spending | $655 | Higher apparel budgets than men in 2023 |
| Men’s apparel spending | $406 | Spending differences remain substantial |
Wardrobe size statistics: how much clothing people actually own
Wardrobe size is one of the most revealing clothing statistics because it connects habits, income, age, and consumption.
Across studies, the average closet is not a small, curated capsule wardrobe—it is a fairly large inventory of items in many different states of use.
Big number
30,056 individual garments were registered among 156 respondents in the wardrobe audit study.
That audit averaged 193 garments per person, with wardrobe size ranging from 44 to 434 garments.
The spread is important: some closets are relatively compact, while others are several times larger than the average.
- 46 pieces per person were dormant in the last 12 months, equal to 24% of the wardrobe.
- Dormant item counts ranged from 2 to 241 per person.
- After correcting for age oversampling, weighted wardrobe size rose slightly to 198 pieces.
- Women had significantly larger wardrobes than men in the audit.
Wardrobe size also rose with age, with a correlation of r = 0.21.
In the same study, the number of pre-owned items was negatively related to age, with r = -0.51, suggesting older wardrobes may be less likely to contain secondhand pieces.
Wardrobe size and pre-owned ownership in the audit
| Audit measure | Value |
|---|---|
| Average garments per person | 193 |
| Weighted average garments per person | 198 |
| Wardrobe size range | 44 to 434 |
| Average dormant items per person | 46 |
| Dormant share | 24% |
| Average pre-owned items per person | 5 |
| Pre-owned share | 2.6% |
| Weighted pre-owned share | 1.9% |
Why it matters
Low pre-owned shares and high dormant shares point to a wardrobe system that still relies heavily on buying, not circulating or reusing, clothing.
Wardrobe statistics on unworn clothing in the UK
The UK wardrobe data is especially useful because it quantifies not just how much clothing people own, but how much of it goes unused.
The headline result is stark: 82% of adults owned at least one item they had not worn in the last 12 months.
Fast facts
- Average unworn tops: 3.5 per adult.
- Estimated unworn tops in total: 175 million.
- Average ties owned: 7.05 per adult.
- Most categories included sizable unworn shares, especially formalwear and occasionwear.
| UK clothing category | Total owned | Not worn in last 12 months | Unworn share |
|---|---|---|---|
| Tops | 175 million | 175 million estimated total unworn tops | Not provided |
| Trousers | 372.0 million | 119.5 million | 32.1% |
| Dresses | 183.0 million | 76.0 million | 41.5% |
| Coats or jackets | 261.0 million | 77.0 million | 29.5% |
| Jeans | 228.0 million | 63.0 million | 27.6% |
| Skirts | 159.5 million | 67.5 million | 42.3% |
| Suits | 93.0 million | 40.0 million | 43.0% |
| Ties | 352.5 million | 208.5 million | 59.2% |
| Swimwear | 116.0 million | 49.0 million | 42.2% |
| Nightwear | 202.0 million | 41.5 million | 20.5% |
Ties stand out as the most underused item in the table. UK adults owned 352.5 million ties, and 208.5 million had not been worn in the last year.
That means ties alone accounted for a huge amount of clothing sitting idle.
- Trousers were the largest category by total ownership at 372.0 million.
- Ties had the largest unworn count at 208.5 million.
- Skirts and suits also showed very high unworn shares, both above 40%.
- Nightwear had the smallest unworn share among the listed categories at 20.5%.
Wardrobe statistics on why clothes go unworn
People do not leave clothes unused for one single reason.
The UK survey shows that wardrobe stagnation comes from planned infrequent use, fit issues, wear and tear, and simple indecision about disposal.
Pull quote
65% of the reasons for not wearing clothes were because the garments were designed as occasional wear.
That single finding is important because it suggests a large part of the wardrobe is built for specific moments rather than regular rotation.
Within that occasional-wear bucket:
- 44% were for formal occasions.
- 37% were for special occasions such as weddings or funerals.
Other barriers were more practical:
- 46% of adults with unworn clothing cited wear and tear.
- 41% said they had not got round to throwing items out.
- 24% said they had too many clothes.
- 17% kept high-value items they did not want to throw out.
- 13% pointed to an unwanted gift.
| Reason for unworn clothing | Share of adults citing it |
|---|---|
| Wear and tear | 46% |
| Not got round to throwing items out | 41% |
| Too many clothes | 24% |
| High-value items kept | 17% |
| Unwanted gift | 13% |
| Broken zip or elastic / another failure | 14% |
| Stains that could not be removed | 10% |
| Misshapen after washing | 10% |
| Colours ran or faded | 9% |
| Shrinkage in the wash | 9% |
Fit is another major issue. Among adults with unworn clothing, 80% said some items no longer fit or required altering.
That is a striking signal that wardrobe waste often starts with garments that no longer match the body as it changes over time.
Wardrobe statistics by gender and fibre preference
The Woolmark wardrobe study offers a useful comparison across female and male wardrobes, showing both changing fabric preferences and differences in how often specific fibers are worn.
At a glance
- Female wardrobe wool share rose from 8% in winter 2012 to 12% in winter 2018.
- Male wardrobe wool share rose from 13% to 16% over the same period.
- Male wardrobes averaged 122 items in winter 2018.
- Male wardrobe ownership increased by 8+ items on average since 2012.
| Measure | Female wardrobe | Male wardrobe |
|---|---|---|
| Wool share in winter 2012 | 8% | 13% |
| Wool share in winter 2018 | 12% | 16% |
| Change in wool share | +4 points | +3 points |
| Average wardrobe items in winter 2018 | Not provided | 122 items |
| Change in ownership since 2012 | Not provided | 8+ items |
The frequency data is equally revealing.
Among males, 33% wore cotton garments several times a week, compared with 29% for polyester and 27% for wool-blend garments.
- Cotton was the most frequently worn material among male respondents.
- Polyester followed closely, showing how common synthetic basics remain.
- Wool-blend use was not far behind, which supports wool’s stronger share in wardrobes by 2018.
Among females, 21% wore wool-blend garments several times per week, equal to denim at 21%.
That parity suggests wool blends have a comparable place in the regular rotation of women’s wardrobes as one of the most common casual fabrics.
Wardrobe statistics on clothing age: what stays in closets for years
Age of garment is one of the clearest indicators of wardrobe longevity.
In the Woolmark study, men’s wardrobes included a notable amount of older wool clothing, but much less old cotton or polyester.
Big number
9% of wool garments in male wardrobes were purchased more than 10 years ago.
| Male wardrobe garment age | Wool | Cotton / Polyester | Other notes |
|---|---|---|---|
| Purchased more than 10 years ago | 9% | 3% | Older wool appears more common than older cotton or polyester |
| Purchased in past 6 months | 10% | About 25% | Wool items are less likely to be recent purchases |
| Purchased in past 6 months | Wool-blend: 10% | Denim: About 33% | Denim turns over faster than wool-blend clothing |
The same study showed that only 10% of wool and wool-blend garments owned by males were bought in the past 6 months, compared with about one quarter of cotton and cotton-blend garments.
Denim was even newer, with about one third of denim garments purchased in the past 6 months.
That pattern suggests wool and wool blends are longer-lived wardrobe staples, while cotton and denim are refreshed more often.
Wardrobe statistics from the Nordic survey: size, usage, and color patterns
The Nordic Textile Collaboration Wardrobe Survey 2023 provides another useful benchmark, especially for how wardrobes are distributed and what the most-used items look like.
Fast facts
- 26% estimated fewer than 100 pieces of clothing.
- 40% estimated 101 to 200 pieces.
- 19% estimated 201 to 300 pieces.
- 15% estimated more than 300 pieces.
| Estimated wardrobe size | Share of Nordic respondents |
|---|---|
| Fewer than 100 pieces | 26% |
| 101 to 200 pieces | 40% |
| 201 to 300 pieces | 19% |
| More than 300 pieces | 15% |
The most-used clothing items were concentrated in everyday basics:
- Pants, jeans and leggings accounted for 35.4% of the top-three most-used clothing responses.
- Long-sleeved shirts and blouses accounted for 33.0%.
- Dresses accounted for 8.1%.
Color was similarly narrow.
Black, blue, gray or white made up 68% of the most-used clothes in the Nordic survey, reinforcing the idea that high-frequency wardrobes lean heavily on neutral basics.
Fabric choice also tilted toward cotton:
- 26% of the most-used Nordic clothes were made from 100% cotton.
- 22% were blends with at least 50% cotton.
- 12.5% were blends with at least 50% polyester.
Wardrobe statistics on least-used items and unmet wardrobe needs
What gets ignored can be just as informative as what gets worn.
In the Nordic survey, the least-used items were often less about style preference and more about simple mismatch.
Why it matters
36% of least-used clothes did not fit the wearer, making fit the leading reason for low use in the Nordic data.
- 20% of least-used clothes had never had an occasion to be worn.
- 19% did not fit the owner’s personal style.
In the Nordic six-month challenge, 58.4% of wardrobe needs were driven by items not being present in the wardrobe.
Damage accounted for another 32.3% of needs.
- 44% of expected wardrobe needs were forecast to be solved by shopping secondhand.
- 24% were forecast to be solved by repairing or redesigning existing clothes.
- 14% were forecast to be solved by buying new textile products.
That mix is notable because the dominant solutions are not fully new purchases.
Secondhand and repair together outpace new buying in the expected response to wardrobe gaps.
Wardrobe statistics on fiber supply: what the closet mix looks like from the top down
To understand wardrobe statistics properly, it helps to zoom out from individual closets to the broader fiber ecosystem.
The Woolmark framing shows a supply landscape dominated by synthetics, with wool a small but growing presence.
| Global fibre supply framing | Share |
|---|---|
| Polyester | 60% |
| Cotton | About 20% |
| Wool | 1.3% |
Polyester’s 60% share dwarfs wool’s 1.3%, while cotton sits far above wool at about 20%.
That supply mix helps explain why everyday wardrobes lean so heavily toward cotton and polyester in usage surveys.
Pull quote
Wool remains a tiny share of global fibre supply, yet its wardrobe share rose in both female and male wardrobes from 2012 to 2018.
Wardrobe statistics on spending: apparel and footwear by household
Spending data puts wardrobe behavior into a household budget context.
In 2023, the Bureau of Labor Statistics showed clear differences between men’s and women’s apparel spending, along with footwear spending that still adds up quickly over a year.
At a glance
- Women’s apparel: $655 per household.
- Men’s apparel: $406 per household.
- Girls’ apparel: $87 per household.
- Boys’ apparel: $96 per household.
| 2023 household spending category | Average annual expenditure |
|---|---|
| Women’s apparel | $655 |
| Men’s apparel | $406 |
| Girls’ apparel | $87 |
| Boys’ apparel | $96 |
| Women’s footwear | $208 |
| Men’s footwear | $147 |
Women’s footwear spending reached $208 per household, compared with $147 for men’s footwear.
The combined apparel and footwear figures underscore how wardrobe-related spending can remain significant even before considering other accessories or outerwear.
The BLS also noted that apparel prices were about 5 times higher in 2024 than a century earlier.
That long-run increase helps explain why older, durable garments can stay in circulation for years and why repair, fit, and wardrobe retention matter so much.
Wardrobe statistics: the most quotable findings
Some of the strongest wardrobe statistics are the ones that sum up the whole story in a single line.
These are the figures most likely to stick with readers, editors, and anyone looking for a sharp data point.
- 82% of UK adults owned at least one unworn item.
- 24% of wardrobes were dormant in the wardrobe audit study.
- 193 garments was the average wardrobe size in that audit.
- 65% of reasons for not wearing clothes came down to occasional wear.
- 80% of adults with unworn clothing said some items no longer fit or needed altering.
- 60% of global fibre supply was polyester, while wool was only 1.3%.
- 44% of expected wardrobe needs in the Nordic challenge were forecast to be solved by buying secondhand.
Why these wardrobe statistics matter
They show that wardrobe behavior is less about having “too little” or “too much” clothing in the abstract and more about fit, occasion, durability, and how often garments actually enter rotation.
Across the datasets, the pattern is consistent: wardrobes are full, but active use is much smaller than total ownership.
That gap is where the biggest opportunities sit for better buying, better fit, repair, and longer clothing life.