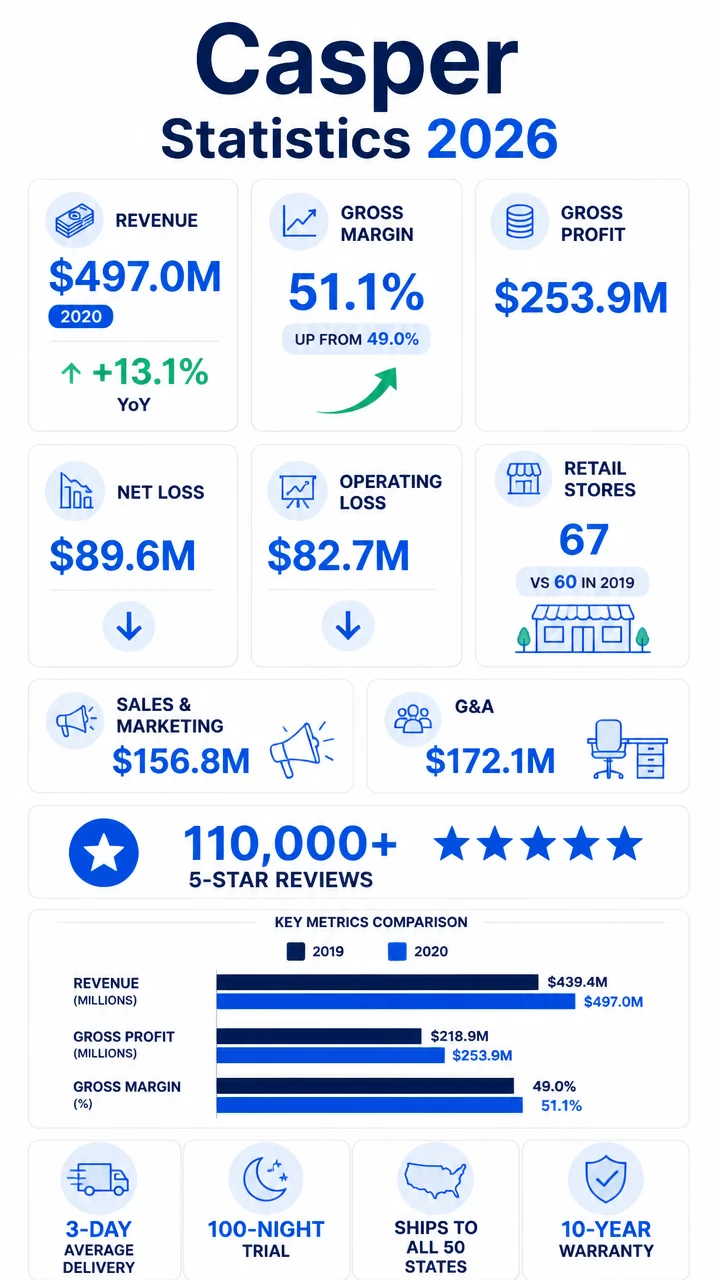
Casper statistics at a glance
Casper’s financial story is best understood as a scale-and-spend business: revenue grew, gross margin improved, and retail expanded, but operating losses remained substantial.
The 2020 filing shows a company still pushing for growth while trying to tighten its economics.
- $497.0 million in revenue in 2020, up 13.1% year over year.
- 51.1% gross margin in 2020, up from 49.0% in 2019.
- 67 retail stores at the end of 2020, up from 60 at the end of 2019.
- $89.6 million net loss in 2020, slightly better than 2019’s $93.0 million net loss.
- 110,000+ 5-star reviews highlighted on Casper’s site.
- Average order-to-delivery period: approximately three days.
- Direct shipping: approximately half of mattresses shipped directly from manufacturers to customers.
- Trial period: 100-night mattress trial with a 30-night adjustment period.
- Distribution: Casper ships to all 50 U.S. states.
- Warranty: 10-year limited warranty.
Casper revenue statistics and growth trends
Casper reported $497.0 million in revenue in 2020, rising by $57.7 million from the prior year, or 13.1%.
That growth rate was slower than 2019’s 22.7% increase, but it still points to an expanding top line in a challenging consumer retail environment.
The company’s 2019 base was already elevated: revenue reached $439.3 million after adding $81.4 million year over year.
In 2020, Casper kept growing, though at a more moderate pace.
| Period | Revenue | Year-over-year change |
|---|---|---|
| Q1 2020 | $113.0 million | N/A |
| 2019 | $439.3 million | +22.7% |
| 2020 | $497.0 million | +13.1% |
Casper’s revenue pattern suggests the brand continued to gain traction, but each incremental dollar likely required more operational complexity, more selling expense, and a larger retail footprint.
Casper gross margin statistics: improving economics, but not enough yet
Gross margin rose to 51.1% in 2020, up from 49.0% in 2019.
That 2.1-point improvement is one of the clearest positive signals in the dataset because it shows Casper making more profit from each sale before operating costs.
Gross profit reached $253.885 million in 2020, while cost of goods sold totaled $243.115 million.
In 2019, gross profit was $215.4 million against $223.8 million in COGS.
So despite higher revenue, the company was still working within a cost structure that required careful discipline.
$253.885 million in gross profit in 2020, up from $215.4 million in 2019.
| Year | Revenue | COGS | Gross profit | Gross margin |
|---|---|---|---|---|
| 2019 | $439.3 million | $223.8 million | $215.4 million | 49.0% |
| 2020 | $497.0 million | $243.115 million | $253.885 million | 51.1% |
The margin improvement matters because Casper operates in a category where logistics, returns, and omnichannel expansion can erode profitability quickly.
A stronger gross margin gives the company more room to absorb selling and overhead expenses.
Casper operating expense statistics and loss profile
Total operating expenses were $336.613 million in 2020, led by $172.071 million in general and administrative expense and $156.806 million in sales and marketing expense.
Those two lines alone account for the majority of the company’s operating burden.
Casper also recorded $7.736 million in restructuring expense.
After those costs, the company posted a $82.728 million loss from operations.
- Sales and marketing expense: $156.806 million
- General and administrative expense: $172.071 million
- Restructuring expense: $7.736 million
- Operating loss: $82.728 million
| Expense line | 2020 amount | Share of revenue |
|---|---|---|
| Sales and marketing | $156.806 million | 31.6% |
| General and administrative | $172.071 million | 34.6% |
| Restructuring | $7.736 million | N/A |
| Total operating expenses | $336.613 million | 67.7% |
Net interest expense was $8.376 million, while other income, net contributed $1.601 million.
After taxes of just $52,000, Casper’s net loss was $89.555 million, essentially unchanged from the broader operating picture.
Casper’s 2020 financial model shows a familiar startup-style tradeoff: growth improved, margins improved, and losses narrowed only slightly.
Casper revenue mix statistics: direct-to-consumer vs retail partnerships
Casper’s channel mix is one of the most important parts of its story.
In 2020, direct-to-consumer revenue was $351.5 million, while retail partnership revenue was $133.6 million.
That means the business was still anchored in its direct channel, but retail partnerships were a meaningful and growing piece of the mix.
In 2019, direct-to-consumer revenue was $350.5 million and retail partnership revenue was $88.8 million.
The retail channel expanded much faster than the direct channel over that period.
| Channel | 2019 revenue | 2020 revenue | Change |
|---|---|---|---|
| Direct-to-consumer | $350.5 million | $351.5 million | +3.6% / +$12.6 million |
| Retail partnership | $88.8 million | $133.6 million | +55.4% in North America retail partnership revenue |
North America retail partnership revenue rose $47.6 million, or 55.4%, in 2020, while North America direct-to-consumer revenue increased $24.4 million, or 7.5%.
That contrast suggests Casper’s retail expansion played a major role in regional growth.
- North America sales rose $72.0 million, or 17.4%, in 2020.
- European sales fell $14.3 million, or 54.4%, in 2020.
- Casper ended 2020 with over 20 retail partners in North America.
Casper’s growth story was increasingly shaped by omnichannel distribution rather than pure e-commerce momentum.
Casper store count statistics and retail footprint growth
Casper ended 2020 with 67 retail stores, up from 60 at the end of 2019.
That increase follows a year of aggressive expansion in 2019, when Casper added 37 net new stores and opened 12 new stores in the fourth quarter alone.
The pace of retail expansion matters because it helps explain the company’s improved partnership revenue, but it also helps explain the high operating expense base.
- 2019 year-end stores: 60
- 2020 year-end stores: 67
- 2019 net new stores: 37
- Q4 2019 store openings: 12
- 2019 retail partners: 18
- 2019 new retail partners launched: 7
Casper’s retail footprint expanded alongside its partner network.
It ended 2019 with 18 retail partners, launched with 7 new retail partners during the year, and added 3 new partners in the fourth quarter.
By 2020, the company had moved into a broader physical presence with more than 20 North American retail partners.
Casper balance sheet statistics: cash, assets, debt, and equity
Cash and cash equivalents were $88.922 million at December 31, 2020, with $3.162 million in restricted cash.
That left Casper with a total cash figure well below the $116.1 million reported in its Q1 2020 investor presentation.
The balance sheet shows a company with meaningful asset base and liabilities, but limited equity relative to accumulated losses.
| Balance sheet item | December 31, 2020 |
|---|---|
| Cash and cash equivalents | $88.922 million |
| Restricted cash | $3.162 million |
| Accounts receivable, net | $27.663 million |
| Inventory, net | $35.531 million |
| Total current assets | $166.304 million |
| Property and equipment, net | $66.529 million |
| Total assets | $234.201 million |
| Accounts payable | $47.612 million |
| Accrued expenses | $54.741 million |
| Deferred revenue | $7.430 million |
| Long-term debt | $65.546 million |
| Total liabilities | $208.734 million |
| Total stockholders’ equity | $25.467 million |
Accumulated deficit reached $414.815 million, while additional paid-in capital was $440.248 million.
That combination underscores how much outside capital supported the company’s expansion model.
- Total assets: $234.201 million
- Total liabilities: $208.734 million
- Total equity: $25.467 million
- Long-term debt: $65.546 million
Casper workforce statistics by region and employment type
Casper reported 634 employees in 2020, including 442 full-time and 192 part-time workers.
Its workforce was heavily concentrated in the United States.
| Location | Employees |
|---|---|
| United States | 599 |
| Canada | 34 |
| United Kingdom | 1 |
That footprint suggests a business still primarily built around North American operations, even as it maintained a limited international presence.
- 442 full-time employees versus 192 part-time employees
- 599 employees in the U.S.
- 34 employees in Canada
- 1 employee in the U.K.
Casper product, delivery, and customer experience statistics
Casper’s customer-facing numbers help explain why the brand became so recognizable.
The company says it offers a 100-night mattress trial, a 30-night adjustment period before returns begin, and a 30-night trial for other snooze supplies.
On the logistics side, Casper says it ships to all 50 U.S. states, offers free mattress delivery, and has an average order-to-delivery period of approximately three days.
It also had two key city markets offering same-day scheduling for in-home set-up at the time of the filing.
These customer experience metrics support Casper’s premium brand position and help justify the company’s focus on convenience, speed, and trial-friendly purchasing.
- 110,000+ 5-star reviews featured on Casper’s homepage.
- 10-year limited warranty offered on products.
- Free mattress delivery is part of the standard offer.
- Approximately half of mattresses were shipped directly from manufacturers to customers.
Casper intellectual property and patent statistics
Casper also built a substantial IP portfolio around its brand and product design.
In 2020, the company reported around four issued U.S. utility patents and six pending U.S. patent applications, along with 19 pending foreign patent applications.
Its design and trademark positions were broader still:
- 8 U.S. design patents
- 9 U.S. design patent applications
- 32 U.S. trademark registrations
- 136 foreign trademark registrations
- 35 pending U.S. trademark applications
- 43 pending foreign trademark applications
- 2 U.S. copyright registrations
- 3 Canadian copyright registrations
For a consumer brand, that level of IP coverage signals an effort to protect both identity and product differentiation across multiple markets.
Casper capital structure and financing statistics
Casper’s revolving credit facility provided up to $30.0 million of borrowing capacity, with an uncommitted accordion for an additional $15.0 million.
That gave the company some flexibility, but not a massive liquidity cushion relative to its size.
Equity compensation was also significant.
Casper’s 2020 RSU grants totaled 2,492,333 units, while PSU grants totaled 259,616 units.
The company also forfeited 508,610 equity units during the year.
- Revolving credit capacity: $30.0 million
- Accordion feature: $15.0 million
- 2020 RSU grants: 2,492,333 units
- 2020 PSU grants: 259,616 units
- 2020 equity units forfeited: 508,610
Casper year-over-year statistics: what changed most from 2019 to 2020
The most useful way to read Casper’s numbers is to compare the two full-year snapshots side by side.
Revenue climbed, gross margin improved, and the business expanded retail footprint, but expenses remained high enough to keep the company in the red.
| Metric | 2019 | 2020 | Change |
|---|---|---|---|
| Revenue | $439.3 million | $497.0 million | +$57.7 million |
| Gross margin | 49.0% | 51.1% | +2.1 points |
| Net loss | $93.0 million | $89.555 million | Improved by $3.5 million |
| Operating loss | N/A | $82.728 million | N/A |
| Stores | 60 | 67 | +7 |
| Retail partners | 18 | 20+ | Expanded |
Most notable shift: retail partnership revenue and North America retail growth outpaced direct-to-consumer growth in 2020, signaling a stronger omnichannel strategy than the year before.
Casper’s 2020 numbers show a brand that was still scaling aggressively, but with better gross economics than in 2019.
Casper statistics FAQ-style takeaways
- How much revenue did Casper make in 2020? Casper reported $497.0 million in revenue.
- Was Casper profitable in 2020? No.
Casper posted a $89.555 million net loss.
- Did margins improve? Yes.
Gross margin increased from 49.0% to 51.1%.
- How many stores did Casper have? Casper ended 2020 with 67 retail stores.
- How fast does Casper deliver? The average order-to-delivery period was about three days.
- How many reviews does Casper claim? The brand says it has 110,000+ 5-star reviews.