IKEA’s latest figures reveal a business that is still enormous in scale, but noticeably changing shape.
From lower revenues and widespread price cuts to record-like customer reach and strong profits, the IKEA statistics for FY24 tell a story of pressure, adaptation, and resilience.
Here’s the short version: IKEA is selling less than a year ago in some core measures, but it is still moving huge volumes, expanding its footprint, and using pricing, services, and circularity to keep customers coming back.
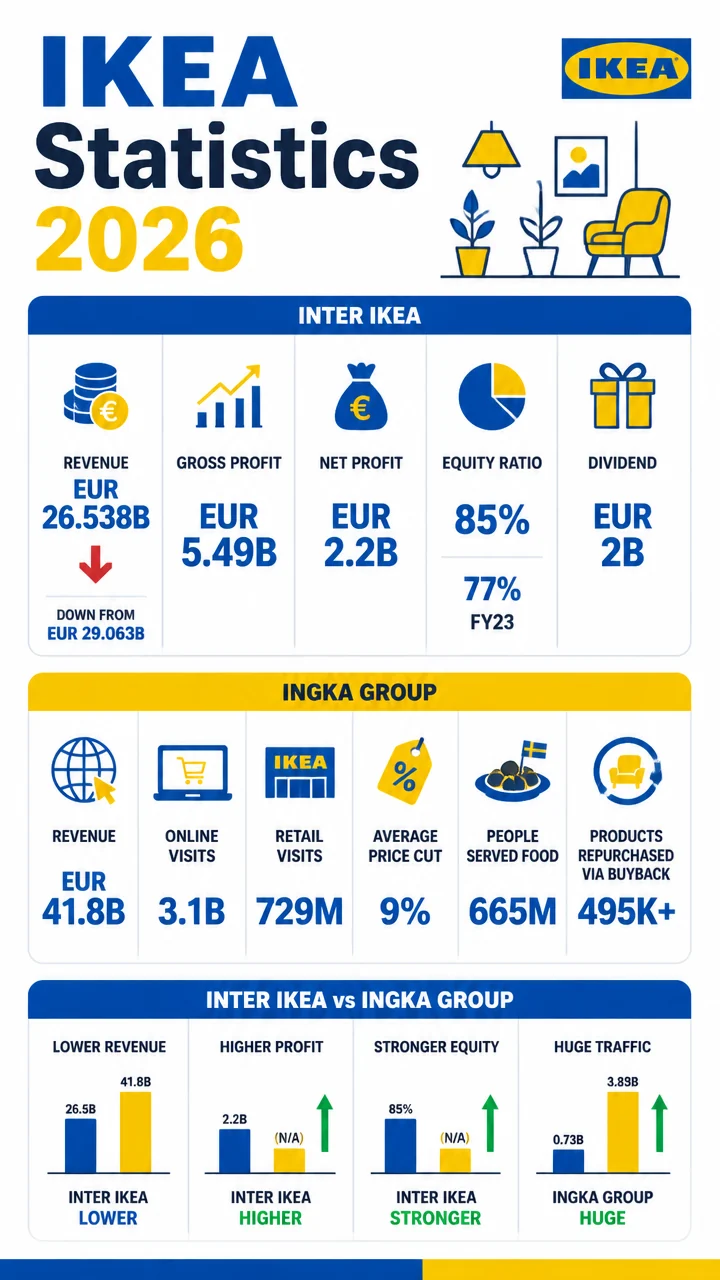
- Inter IKEA Group revenue fell to EUR 26.538 billion in FY24 from EUR 29.063 billion in FY23.
- Ingka Group revenue reached EUR 41.8 billion, supported by 3.1 billion online visits and 729 million retail visits.
- Prices fell across the business, including a 9% average reduction in Ingka Group product prices.
- Food, financing, and buyback services remained major demand drivers, with 665 million people served food and 495,000+ products repurchased through Buyback.
IKEA statistics at a glance
| Metric | FY24 figure | What it suggests |
|---|---|---|
| Total revenue, Inter IKEA Group | EUR 26.538 billion | Lower than FY23, but still massive scale |
| Total revenue, Ingka Group | EUR 41.8 billion | Retail engine remains the biggest sales driver |
| Online visits, Ingka Group | 3.1 billion | Digital demand remains enormous |
| Retail visits, Ingka Group | 729 million | Physical stores still generate huge traffic |
| Product price cut, Ingka Group | 9% | Affordability was a clear priority |
| People served food, Ingka Group | 665 million | Food is a major part of the IKEA experience |
| Buyback products repurchased | 495,000+ | Circular services are scaling |
- Inter IKEA Group operates in 63 markets.
- Ingka Group operates 574 IKEA retail locations in 31 countries.
- Inter IKEA Group opened 56 new sales locations in the past year.
- Inter IKEA Group sources 90% of the product range from 800+ external suppliers.
- Ingka Investments managed EUR 27 billion in assets.
IKEA revenue statistics: the size of the business in FY24
Inter IKEA Group generated EUR 26.538 billion in total revenues in FY24, down from EUR 29.063 billion in FY23.
That is a meaningful year-over-year decline, but it still leaves the company operating at extraordinary scale.
Within that total, Inter IKEA Group recorded:
- EUR 25.061 billion in sales of goods, down from EUR 27.443 billion in FY23.
- EUR 1.348 billion in franchise fees, down from EUR 1.406 billion in FY23.
- EUR 5.490 billion in gross profit, up from EUR 5.239 billion in FY23.
The mix matters.
Sales declined, but gross profit improved, showing that revenue and profit did not move in lockstep.
For an operation as large as IKEA, that kind of split is a key signal of how pricing, sourcing, and cost discipline can affect the bottom line.
EUR 2.2 billion in net profit is a reminder that even with falling revenues, Inter IKEA Group remained highly profitable in FY24.
Inter IKEA Group FY24 vs FY23 comparison
| Metric | FY24 | FY23 |
|---|---|---|
| Total revenues | EUR 26.538 billion | EUR 29.063 billion |
| Sales of goods | EUR 25.061 billion | EUR 27.443 billion |
| Franchise fees | EUR 1.348 billion | EUR 1.406 billion |
| Gross profit | EUR 5.490 billion | EUR 5.239 billion |
| Operational cost | EUR 3.151 billion | EUR 2.993 billion |
| Co-worker base (average FTE) | 23,892 | 24,944 |
Why it matters: the revenue decline happened alongside a rise in gross profit and operational cost, which makes FY24 look less like a simple contraction and more like a year of active repositioning.
IKEA profitability and tax statistics
IKEA’s profit metrics show a business that stayed financially strong even as revenue softened.
Inter IKEA Group’s net profit reached EUR 2.2 billion in FY24, while its gross profit rose to EUR 5.490 billion.
On the tax side, the group reported:
- EUR 466 million in tax charge.
- EUR 2.140 billion in total tax contribution.
- 17.5% tax charge as a share of pre-tax income.
That total tax contribution is especially notable because it goes well beyond the accounting tax charge.
For investors and market watchers, it’s another reminder that IKEA’s footprint is financial as well as retail-wide.
EUR 2 billion is the total dividend planned for FY24, after an interim dividend of EUR 1 billion was already paid during the year.
IKEA market reach statistics: where the brand shows up
IKEA’s scale is not just financial.
Its reach spans markets, stores, plan-and-order points, and meeting places.
In FY24, Ingka Group operated:
- 574 IKEA retail locations in 31 countries.
- 400 stores and 174 plan and order points.
- 35 Ingka Centres in 13 countries.
Inter IKEA Group also reported that it operates in 63 markets through the IKEA franchise system as of 31 August 2024.
That split between franchise reach and retail execution helps explain how IKEA can feel omnipresent even though it does not own every touchpoint.
- 56 new sales locations were opened in the past year.
- Ingka Group generated 87.8% of total IKEA Retail sales.
- Ingka Group logged 729 million visits to IKEA retail locations.
- Ingka Centres recorded 271 million visits.
IKEA physical footprint in FY24
| Location type | Count | Geographic scope |
|---|---|---|
| IKEA retail locations, Ingka Group | 574 | 31 countries |
| IKEA stores | 400 | Part of Ingka Group retail business |
| Plan and order points | 174 | Part of Ingka Group retail business |
| Ingka Centres | 35 | 13 countries |
| New sales locations opened | 56 | Past year |
Notable pattern: the IKEA experience is increasingly spread across formats, not just big-box stores.
That matters because the brand can meet shoppers at different stages of the buying journey.
IKEA online and store traffic statistics
If there’s one headline for IKEA demand in FY24, it is this: 3.1 billion online visits and 729 million visits to physical retail locations.
The digital side clearly dominates in raw traffic, but stores still generate massive volume.
That traffic is supported by a broad retail ecosystem:
- 162,293 co-workers at Ingka Group.
- 3.1 billion online visits in FY24.
- 729 million retail visits in FY24.
- 271 million visits to Ingka Centres.
These numbers show that IKEA is not relying on one channel.
It is running a multi-format, multi-traffic model that combines ecommerce discovery, in-store conversion, and destination-based visits.
IKEA pricing statistics: affordability stayed central in FY24
One of the clearest themes in the FY24 IKEA statistics is price pressure relief for customers.
Ingka Group lowered product prices by an average of 9% versus FY23 and lowered service prices by 9% as well.
The company said it spent EUR 2.1 billion lowering prices across markets in FY24.
In the UK alone, IKEA UK invested more than GBP 117 million in lowering prices during the year.
That suggests a deliberate strategy: protect demand by making the brand more affordable, even while absorbing significant margin pressure.
For a household-furnishings company, that is not a side note — it is the core business story.
9% was the average reduction in product prices across Ingka Group in FY24.
Key pricing actions in FY24
- 9% average product price reduction.
- 9% service price reduction.
- EUR 2.1 billion spent lowering prices.
- GBP 117 million+ invested in price reductions in the UK.
IKEA financing and customer support statistics
IKEA’s payment and financing services are an important part of how customers afford bigger purchases.
In FY24, Ingka Group’s financing services were available in 30 markets, and its financing simulator was available in 12 countries.
The most telling figure is customer reliance: 60% of customers using Ingka Group financial services said they could not afford their purchase fully or partially without that support.
That makes financing not just a convenience, but a purchase-enabling tool.
- Financing expanded to loan services in Canada and Serbia.
- Instalment payment services expanded to Canada, Belgium, the Netherlands, Serbia, and the US.
30 markets had access to financing services, showing how important flexible payment options are to IKEA’s sales model.
IKEA circular economy and Buyback statistics
IKEA’s circular services are growing alongside its traditional retail business.
Around 260,400 customers across 28 countries used Buyback in FY24, and IKEA repurchased over 495,000 used products through the program.
That’s a meaningful scale for a resale model inside a giant home-furnishings business.
It suggests IKEA is making circularity more operational, not just promotional.
Additional support services also scaled:
- Over 25.8 million free assembly parts were provided.
- Those parts went to 2.2 million customers.
- The waste watcher tool was used in 429 stores.
Circularity, assembly support, and waste reduction are not peripheral services.
They help IKEA keep products in use longer, reduce friction after purchase, and reinforce value perception.
IKEA food statistics: the dining side of the business is huge
Food is one of IKEA’s most distinctive traffic drivers, and the FY24 figures show just how large it has become.
Ingka Group served food to around 665 million people during the year.
That number helps explain why food remains central to the IKEA experience.
It is part cafe, part customer retention tool, and part brand signature.
The company also used targeted promotions such as the Happy Days campaign, which gave IKEA Family members a 50% discount on main courses one day a week.
- 665 million people served food in FY24.
- 141,860+ Too Good To Go surprise bags sold.
- Happy Days offered a 50% main-course discount for members one day a week.
665 million people served food is one of the most striking IKEA statistics in the entire dataset.
IKEA workforce and operating model statistics
IKEA’s workforce footprint is still enormous, even though some measures moved lower in FY24.
Inter IKEA Group’s average FTE co-worker base fell to 23,892 from 24,944 in FY23.
At the same time, Ingka Group employed 162,293 co-workers in FY24.
The difference between the two groups reflects IKEA’s layered business structure, where one organization focuses on franchise and system-level operations while the other runs the retail business.
- Inter IKEA Group is relatively lean compared with the retail-facing Ingka business.
- Ingka carries the customer-facing scale, from stores and online traffic to services and fulfillment.
- Operational complexity is spread across sourcing, retail, financing, food, and circular services.
IKEA supply chain and manufacturing statistics
IKEA’s supply base is still built around a hybrid model.
Inter IKEA Group manufactures about 10% of the IKEA product range, while the remaining 90% is sourced from 800+ external suppliers.
The company owns around 35 factories, most of them in Europe.
That combination — a relatively small in-house manufacturing base and a broad external supplier network — is part of what gives IKEA its scale and flexibility.
| Supply chain metric | FY24 figure | Interpretation |
|---|---|---|
| Product range manufactured in-house | 10% | Selective vertical integration |
| Product range sourced externally | 90% | Highly supplier-dependent model |
| External suppliers | 800+ | Large global sourcing network |
| Factories owned | 35 | Most in Europe |
Why it matters: IKEA can push volume through a massive supplier ecosystem without owning the full manufacturing burden of every product line.
IKEA balance sheet statistics: assets, cash, and equity strength
Inter IKEA Group’s balance sheet looks sturdy.
Its equity ratio rose to 85% in FY24 from 77% in FY23, and equity increased by EUR 1.5 billion during the year.
At 31 August 2024, the company reported:
- EUR 8.821 billion in intangible fixed assets.
- EUR 1.794 billion in tangible fixed assets.
- EUR 4.164 billion in cash and cash equivalents.
- EUR 22.472 billion in total assets.
Those figures suggest a capital structure with strong equity backing and plenty of liquidity.
For a business with global operations and a complex franchise model, that balance sheet strength matters.
85% equity ratio is one of the most striking financial stability metrics in the FY24 data.
IKEA sustainability and waste statistics
The FY24 data also shows sustainability becoming more embedded in day-to-day operations rather than treated as a separate initiative.
A few numbers stand out:
- 141,860+ Too Good To Go surprise bags sold.
- 429 stores used the waste watcher tool.
- 25.8 million free assembly parts were provided.
- 2.2 million customers received those parts.
- 495,000+ used products were repurchased through Buyback.
These are practical, customer-facing sustainability metrics.
They show IKEA working to keep food from going to waste, products in circulation longer, and after-sale support more efficient.
260,400 customers used Buyback across 28 countries, showing that circular retail is moving beyond pilot scale.
IKEA statistics by business segment: the strongest FY24 signals
Some of the most useful IKEA statistics are the ones that show where the company is leaning for growth and resilience.
- Retail remains the core engine: Ingka Group revenue hit EUR 41.8 billion.
- Digital demand is huge: 3.1 billion online visits.
- Physical stores still matter: 729 million retail visits.
- Affordability is the main lever: 9% lower prices and EUR 2.1 billion spent on reductions.
- Services are critical: financing in 30 markets, Buyback in 28 countries, and food served to 665 million people.
The broad pattern is clear: IKEA is not depending on one growth engine.
It is using price, services, circularity, and scale together to keep the brand relevant in a difficult retail environment.
IKEA statistics FAQ-style highlights
How many countries does IKEA operate in? Ingka Group operated in 31 countries through 574 retail locations, while Inter IKEA Group said the franchise system spans 63 markets.
How many people work for IKEA? Ingka Group had 162,293 co-workers in FY24, while Inter IKEA Group’s average FTE base was 23,892.
How many customers visit IKEA? Ingka Group reported 3.1 billion online visits and 729 million retail visits in FY24.
What is IKEA doing on affordability? Ingka Group cut product and service prices by 9% on average and spent EUR 2.1 billion lowering prices across markets.
How big is IKEA’s circular business? Buyback reached 260,400 customers in 28 countries and repurchased 495,000+ used products.
How important is food to IKEA? Very.
Ingka Group served food to about 665 million people in FY24.